Code
library(ggplot2)
library(data.table)
library(patchwork)

base_dir <- here::here()
source(file.path(base_dir, "sim-analyze.R"))

mcols <- method_colors()
mlabs <- method_labels()
dlabs <- dgp_short_labels()Registration Benchmark v2
library(ggplot2)
library(data.table)
library(patchwork)
base_dir <- here::here()
source(file.path(base_dir, "sim-analyze.R"))
mcols <- method_colors()
mlabs <- method_labels()
dlabs <- dgp_short_labels()dt <- load_study_c()Study C tests whether grid resolution is a confound for method comparison. SRVF operates on SRSFs (numerical derivatives) which amplify discretization artifacts at finer grids. A preliminary pilot (job 5131384) showed SRVF warp MISE 1.82× worse at \(n_\text{grid}=201\) vs 101.
Design: 5 DGPs \(\times\) 3 grid sizes (51, 101, 201) \(\times\) 3 noise (0, 0.1, 0.3) \(\times\) 5 methods \(\times\) severity=1.0 = 225 cells \(\times\) 50 reps = 11,250 runs.
dgps_used <- c("D01", "D03", "D04", "D09", "D12")
knitr::kable(
  dgp_factors()[dgp %in% dgps_used],
  caption = "DGPs in Study C: covering both templates, all 3 warp types, and none/highrank amplitude."
)| dgp | template | warp_type | amplitude |
|---|---|---|---|
| D01 | harmonic | simple | none |
| D03 | wiggly | complex | none |
| D04 | harmonic | affine | none |
| D09 | harmonic | simple | highrank |
| D12 | wiggly | complex | highrank |
fail_dt <- dt[,
  .(n_fail = sum(failure), n_total = .N, rate = mean(failure)),
  by = .(method, n_grid)
]
fail_any <- fail_dt[n_fail > 0]
if (nrow(fail_any) == 0) {
  cat("No failures across all 11,250 runs.\n\n")
} else {
  cat("**Failure rates by method and grid:**\n\n")
  print(knitr::kable(fail_dt[n_fail > 0]))
}
Failure rates by method and grid:
| method | n_grid | n_fail | n_total | rate |
|---|---|---|---|---|
| landmark_auto | 51 | 3 | 750 | 0.004 |
| landmark_auto | 101 | 6 | 750 | 0.008 |
| landmark_auto | 201 | 1 | 750 | 0.001 |
The central question: does grid resolution systematically affect method performance?
ggplot(
  dt[failure == FALSE],
  aes(y = method, x = warp_mise, fill = n_grid)
) +
  geom_boxplot(outlier.size = 0.3, outlier.alpha = 0.2, position = "dodge") +
  facet_wrap(~noise_sd, labeller = labeller(noise_sd = function(x) paste0("noise=", x))) +
  scale_y_discrete(labels = mlabs) +
  scale_x_log10() +
  scale_fill_brewer(palette = "Set2", name = "Grid size") +
  labs(y = NULL, x = "Warp MISE (log scale)") +
  theme_benchmark()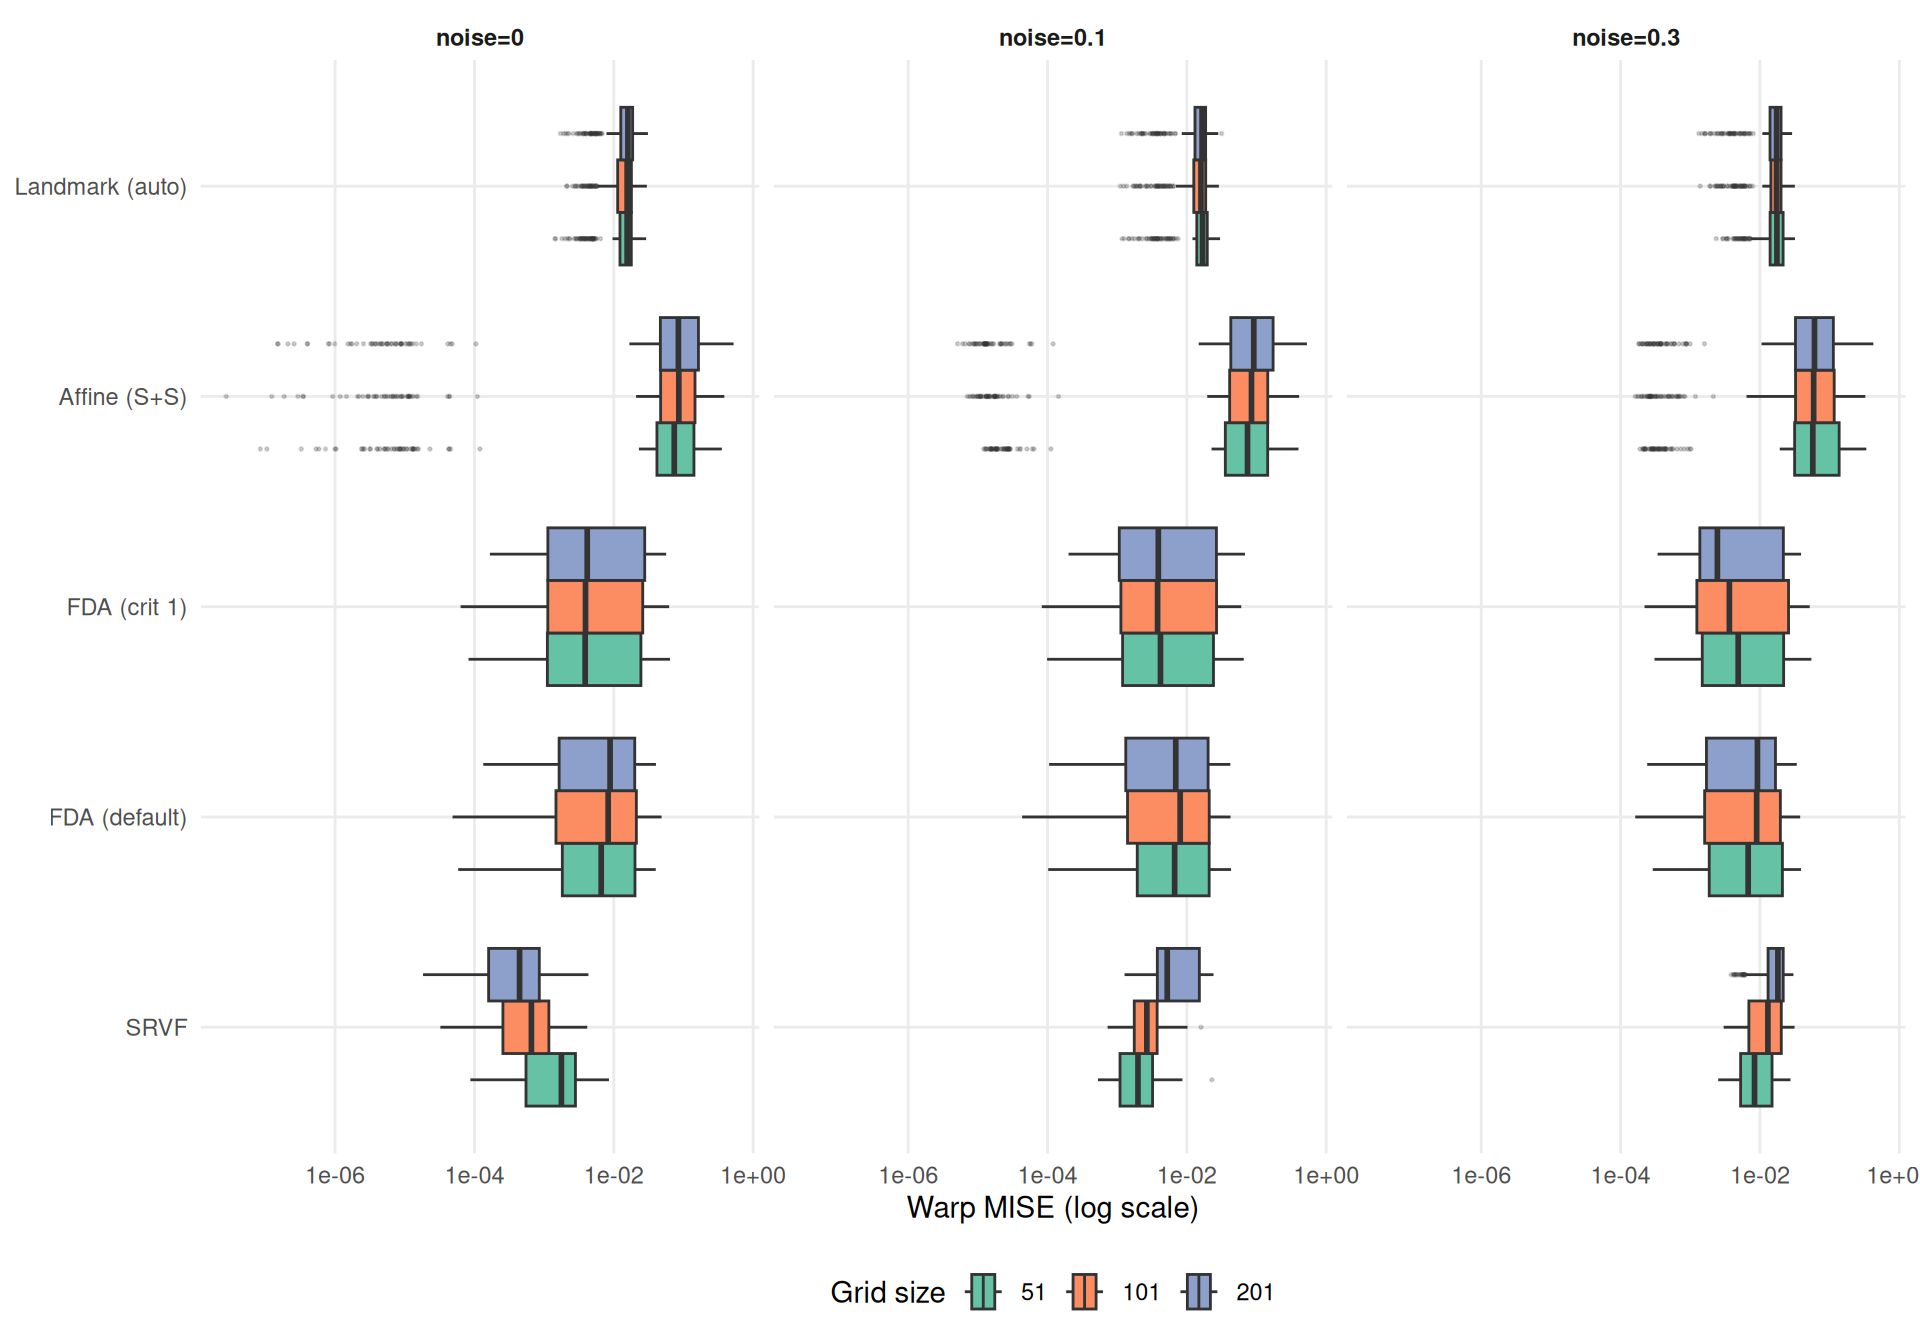
Grid degradation ratios compare each grid size to the baseline \(n_\text{grid}=101\). Values > 1 mean worse performance at that grid; < 1 means better.
ratio_rep <- dcast(
  dt[failure == FALSE, .(dgp, method, noise_sd, rep, n_grid, warp_mise)],
  dgp + method + noise_sd + rep ~ n_grid,
  value.var = "warp_mise"
)
ratio_rep[, ratio_51 := `51` / `101`]
ratio_rep[, ratio_201 := `201` / `101`]
ratio_rep <- melt(
  ratio_rep,
  id.vars = c("dgp", "method", "noise_sd", "rep"),
  measure.vars = c("ratio_51", "ratio_201"),
  variable.name = "n_grid",
  value.name = "ratio"
)
ratio_rep[, n_grid := sub("^ratio_", "", n_grid)]
ratio_dt <- ratio_rep[, .(
  ratio = median(ratio, na.rm = TRUE),
  q25 = quantile(ratio, 0.25, na.rm = TRUE),
  q75 = quantile(ratio, 0.75, na.rm = TRUE)
), by = .(dgp, method, n_grid, noise_sd)]

ggplot(ratio_dt, aes(x = ratio, y = method, color = method)) +
  geom_vline(xintercept = 1, linetype = "dashed", color = "grey40") +
  geom_point(size = 2, alpha = 0.7) +
  geom_errorbarh(aes(xmin = q25, xmax = q75), height = 0.15, alpha = 0.3) +
  geom_text(aes(label = dgp), size = 3, vjust = -0.8, show.legend = FALSE) +
  stat_summary(fun = median, geom = "crossbar", width = 0.4,
    color = "black", linewidth = 0.4) +
  facet_grid(n_grid ~ noise_sd,
    labeller = labeller(
      noise_sd = function(x) paste0("noise=", x),
      n_grid = function(x) paste0("grid=", x)
    )
  ) +
  scale_color_manual(values = mcols, guide = "none") +
  scale_y_discrete(labels = mlabs) +
  scale_x_continuous(trans = "log2",
    breaks = c(0.25, 0.5, 1, 2, 4),
    labels = c("1/4", "1/2", "1", "2", "4")
  ) +
  labs(x = expression("Warp MISE ratio vs grid=101 (" * log[2] * " scale)"), y = NULL) +
  theme_benchmark()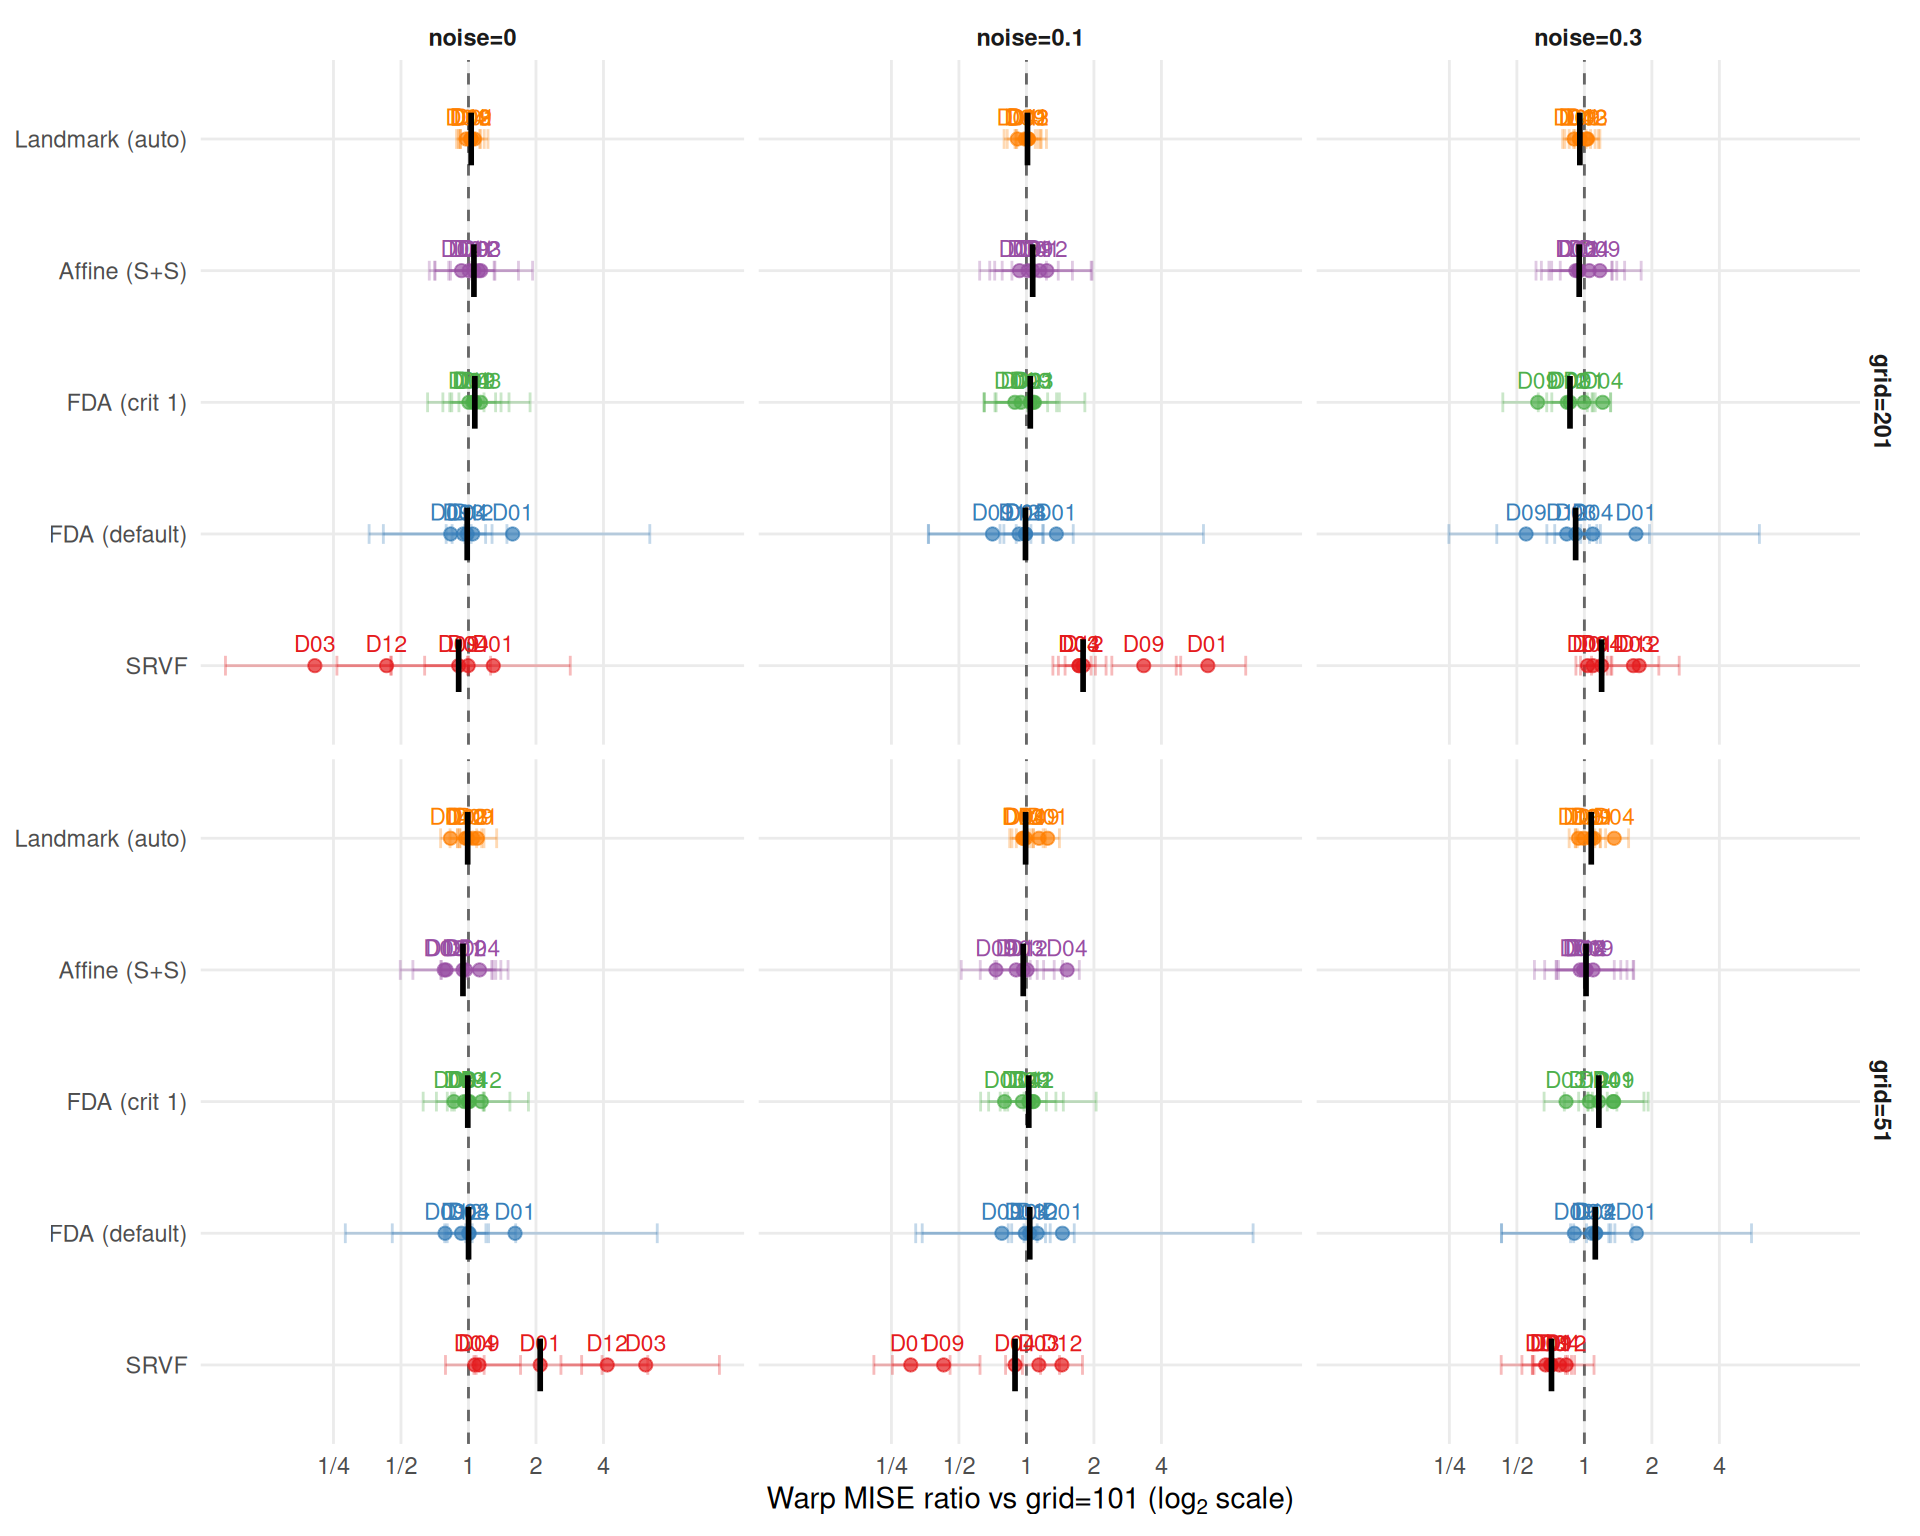
# Median ratio per method x grid x noise
ratio_by_noise <- ratio_dt[,
  .(median_ratio = median(ratio, na.rm = TRUE)),
  by = .(method, n_grid, noise_sd)
]
ratio_uncertainty <- mean_se_table(ratio_dt, "ratio", c("method", "n_grid", "noise_sd"))

# SRVF noise-dependent reversal (the key finding)
srvf_rats <- ratio_by_noise[method == "srvf"]
srvf_unc <- ratio_uncertainty[method == "srvf"]
cat("**Key finding: SRVF grid sensitivity reverses with noise level.**\n\n")
Key finding: SRVF grid sensitivity reverses with noise level.
tbl_lines <- c(
  "SRVF warp MISE ratios (vs grid=101):\n",
  "| Noise | grid=51 | grid=201 |",
  "|-------|---------|----------|"
)
for (ns in c("0", "0.1", "0.3")) {
  r51 <- srvf_rats[n_grid == "51" & noise_sd == ns, median_ratio]
  r201 <- srvf_rats[n_grid == "201" & noise_sd == ns, median_ratio]
  se51 <- srvf_unc[n_grid == "51" & noise_sd == ns, se]
  se201 <- srvf_unc[n_grid == "201" & noise_sd == ns, se]
  tbl_lines <- c(tbl_lines, sprintf(
    "| %s | %.2f ± %.2f | %.2f ± %.2f |",
    ns, r51, se51, r201, se201
  ))
}
cat(paste(tbl_lines, collapse = "\n"), "\n\n")
SRVF warp MISE ratios (vs grid=101):
| Noise | grid=51 | grid=201 |
|---|---|---|
| 0 | 2.26 ± 0.87 | 0.91 ± 0.19 |
| 0.1 | 0.93 ± 0.21 | 1.73 ± 0.92 |
| 0.3 | 0.73 ± 0.02 | 1.20 ± 0.19 |
cat("At noise=0, coarser grid *hurts* SRVF — DP alignment on 51 points is too ",
  "imprecise to resolve the warp. At noise>0, finer grid *hurts* SRVF — ",
  "numerical differentiation amplifies noise at 201 points, acting as ",
  "de facto anti-regularization.\n\n")
At noise=0, coarser grid hurts SRVF — DP alignment on 51 points is too imprecise to resolve the warp. At noise>0, finer grid hurts SRVF — numerical differentiation amplifies noise at 201 points, acting as de facto anti-regularization.
# All methods summary
cat("**All methods** (median ratio, pooled over DGPs and noise — ",
  "descriptive only; SRVF pooled medians mask the noise-dependent reversal above):\n\n")
All methods (median ratio, pooled over DGPs and noise — descriptive only; SRVF pooled medians mask the noise-dependent reversal above):
ratio_summary <- ratio_dt[,
  .(
    median_ratio = median(ratio, na.rm = TRUE),
    mean_ratio = mean(ratio, na.rm = TRUE),
    se_ratio = if (.N > 1) sd(ratio, na.rm = TRUE) / sqrt(.N) else 0,
    min_ratio = min(ratio, na.rm = TRUE),
    max_ratio = max(ratio, na.rm = TRUE)
  ),
  by = .(method, n_grid)
]
for (g in sort(unique(as.character(ratio_summary$n_grid)))) {
  cat(sprintf("*Grid = %s:*\n\n", g))
  sub <- ratio_summary[n_grid == g][order(median_ratio)]
  for (i in seq_len(nrow(sub))) {
    cat(sprintf("- **%s**: median %.2f; mean %.2f ± %.2f; range [%.2f, %.2f]\n",
      mlabs[sub$method[i]], sub$median_ratio[i],
      sub$mean_ratio[i], sub$se_ratio[i],
      sub$min_ratio[i], sub$max_ratio[i]))
  }
  cat("\n")
}
Grid = 201:
Grid = 51:
ggplot(
  dt[failure == FALSE],
  aes(y = method, x = template_mise, fill = n_grid)
) +
  geom_boxplot(outlier.size = 0.3, outlier.alpha = 0.2, position = "dodge") +
  facet_wrap(~noise_sd, labeller = labeller(noise_sd = function(x) paste0("noise=", x))) +
  scale_y_discrete(labels = mlabs) +
  scale_x_log10() +
  scale_fill_brewer(palette = "Set2", name = "Grid size") +
  labs(y = NULL, x = "Template MISE (log scale)") +
  theme_benchmark()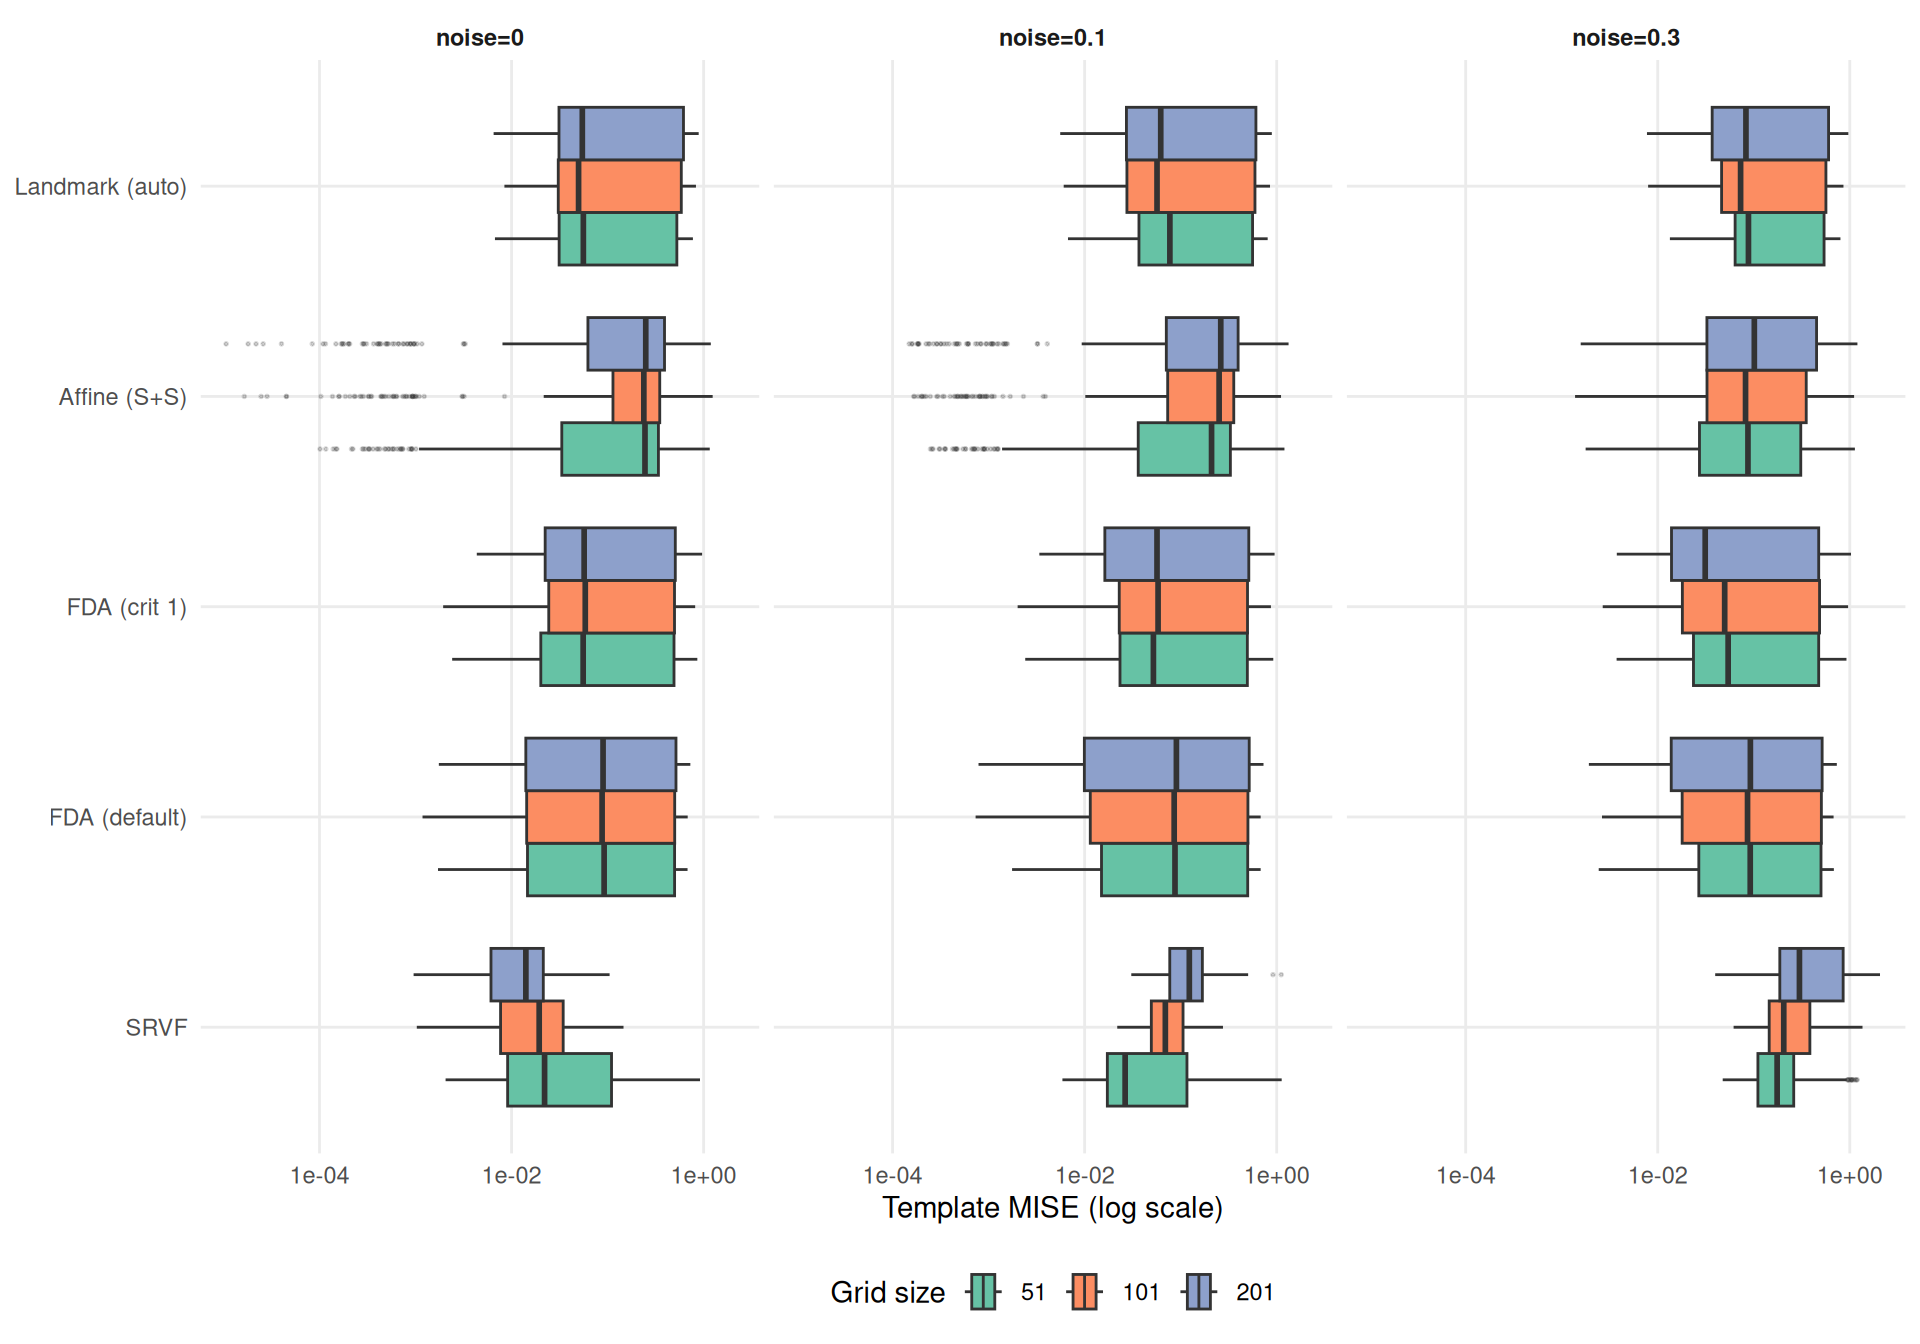
t_ratio_rep <- dcast(
  dt[failure == FALSE, .(dgp, method, noise_sd, rep, n_grid, template_mise)],
  dgp + method + noise_sd + rep ~ n_grid,
  value.var = "template_mise"
)
t_ratio_rep[, ratio_51 := `51` / `101`]
t_ratio_rep[, ratio_201 := `201` / `101`]
t_ratio_rep <- melt(
  t_ratio_rep,
  id.vars = c("dgp", "method", "noise_sd", "rep"),
  measure.vars = c("ratio_51", "ratio_201"),
  variable.name = "n_grid",
  value.name = "ratio"
)
t_ratio_rep[, n_grid := sub("^ratio_", "", n_grid)]
t_ratio_dt <- t_ratio_rep[, .(
  ratio = median(ratio, na.rm = TRUE),
  q25 = quantile(ratio, 0.25, na.rm = TRUE),
  q75 = quantile(ratio, 0.75, na.rm = TRUE)
), by = .(dgp, method, n_grid, noise_sd)]

ggplot(t_ratio_dt, aes(x = ratio, y = method, color = method)) +
  geom_vline(xintercept = 1, linetype = "dashed", color = "grey40") +
  geom_point(size = 2, alpha = 0.7) +
  geom_errorbarh(aes(xmin = q25, xmax = q75), height = 0.15, alpha = 0.3) +
  geom_text(aes(label = dgp), size = 3, vjust = -0.8, show.legend = FALSE) +
  stat_summary(fun = median, geom = "crossbar", width = 0.4,
    color = "black", linewidth = 0.4) +
  facet_grid(n_grid ~ noise_sd,
    labeller = labeller(
      noise_sd = function(x) paste0("noise=", x),
      n_grid = function(x) paste0("grid=", x)
    )
  ) +
  scale_color_manual(values = mcols, guide = "none") +
  scale_y_discrete(labels = mlabs) +
  scale_x_continuous(trans = "log2",
    breaks = c(0.25, 0.5, 1, 2, 4),
    labels = c("1/4", "1/2", "1", "2", "4")
  ) +
  labs(x = expression("Template MISE ratio vs grid=101 (" * log[2] * " scale)"), y = NULL) +
  theme_benchmark()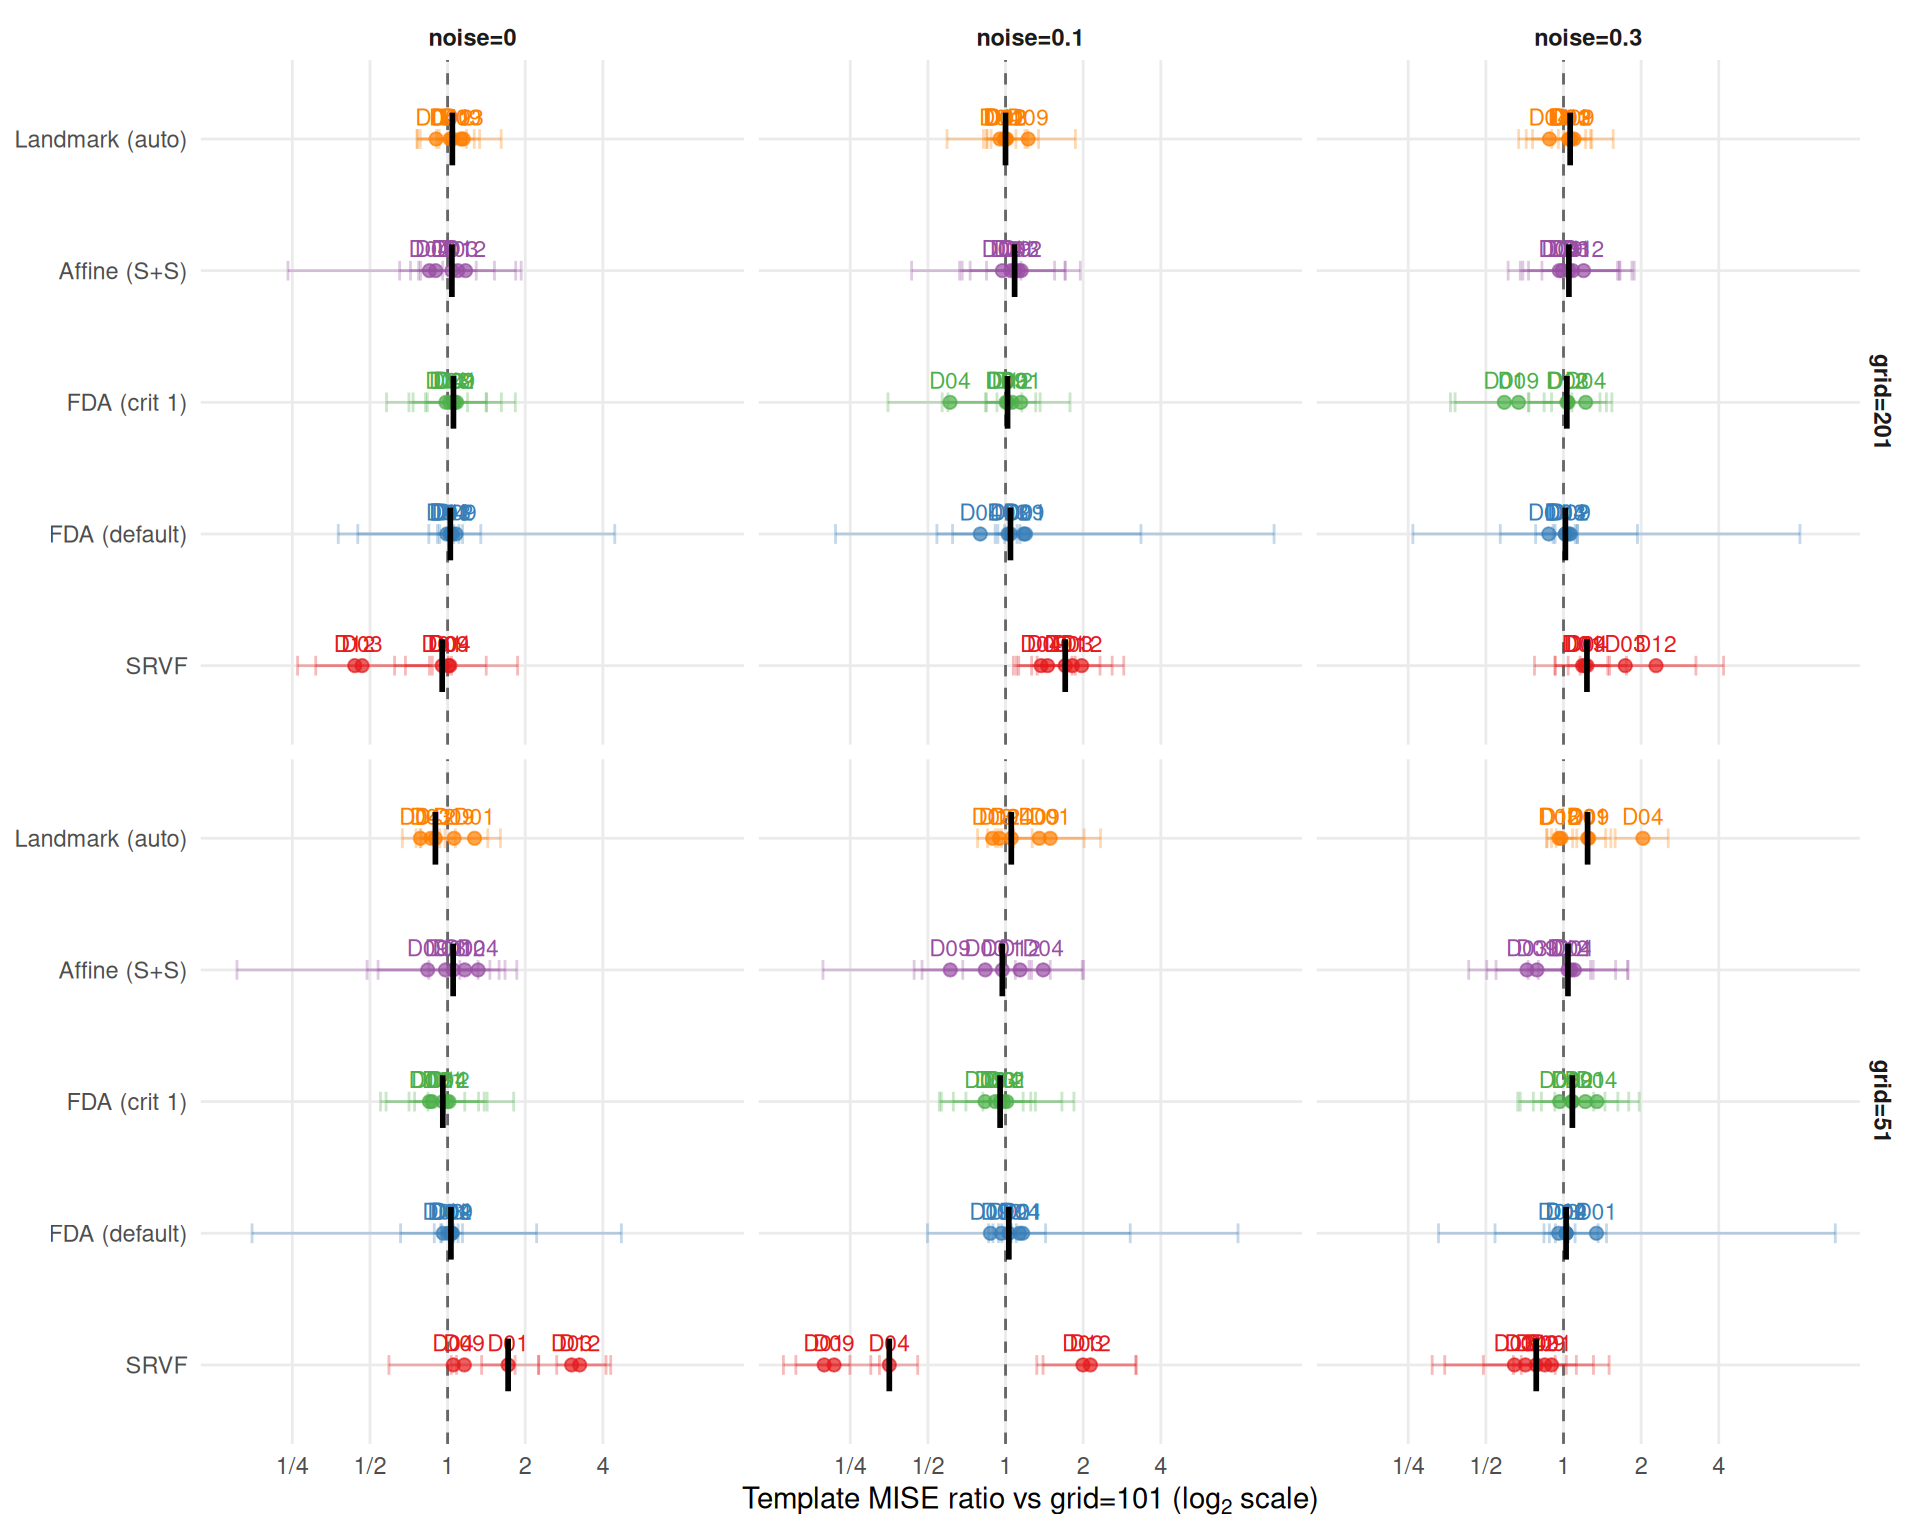
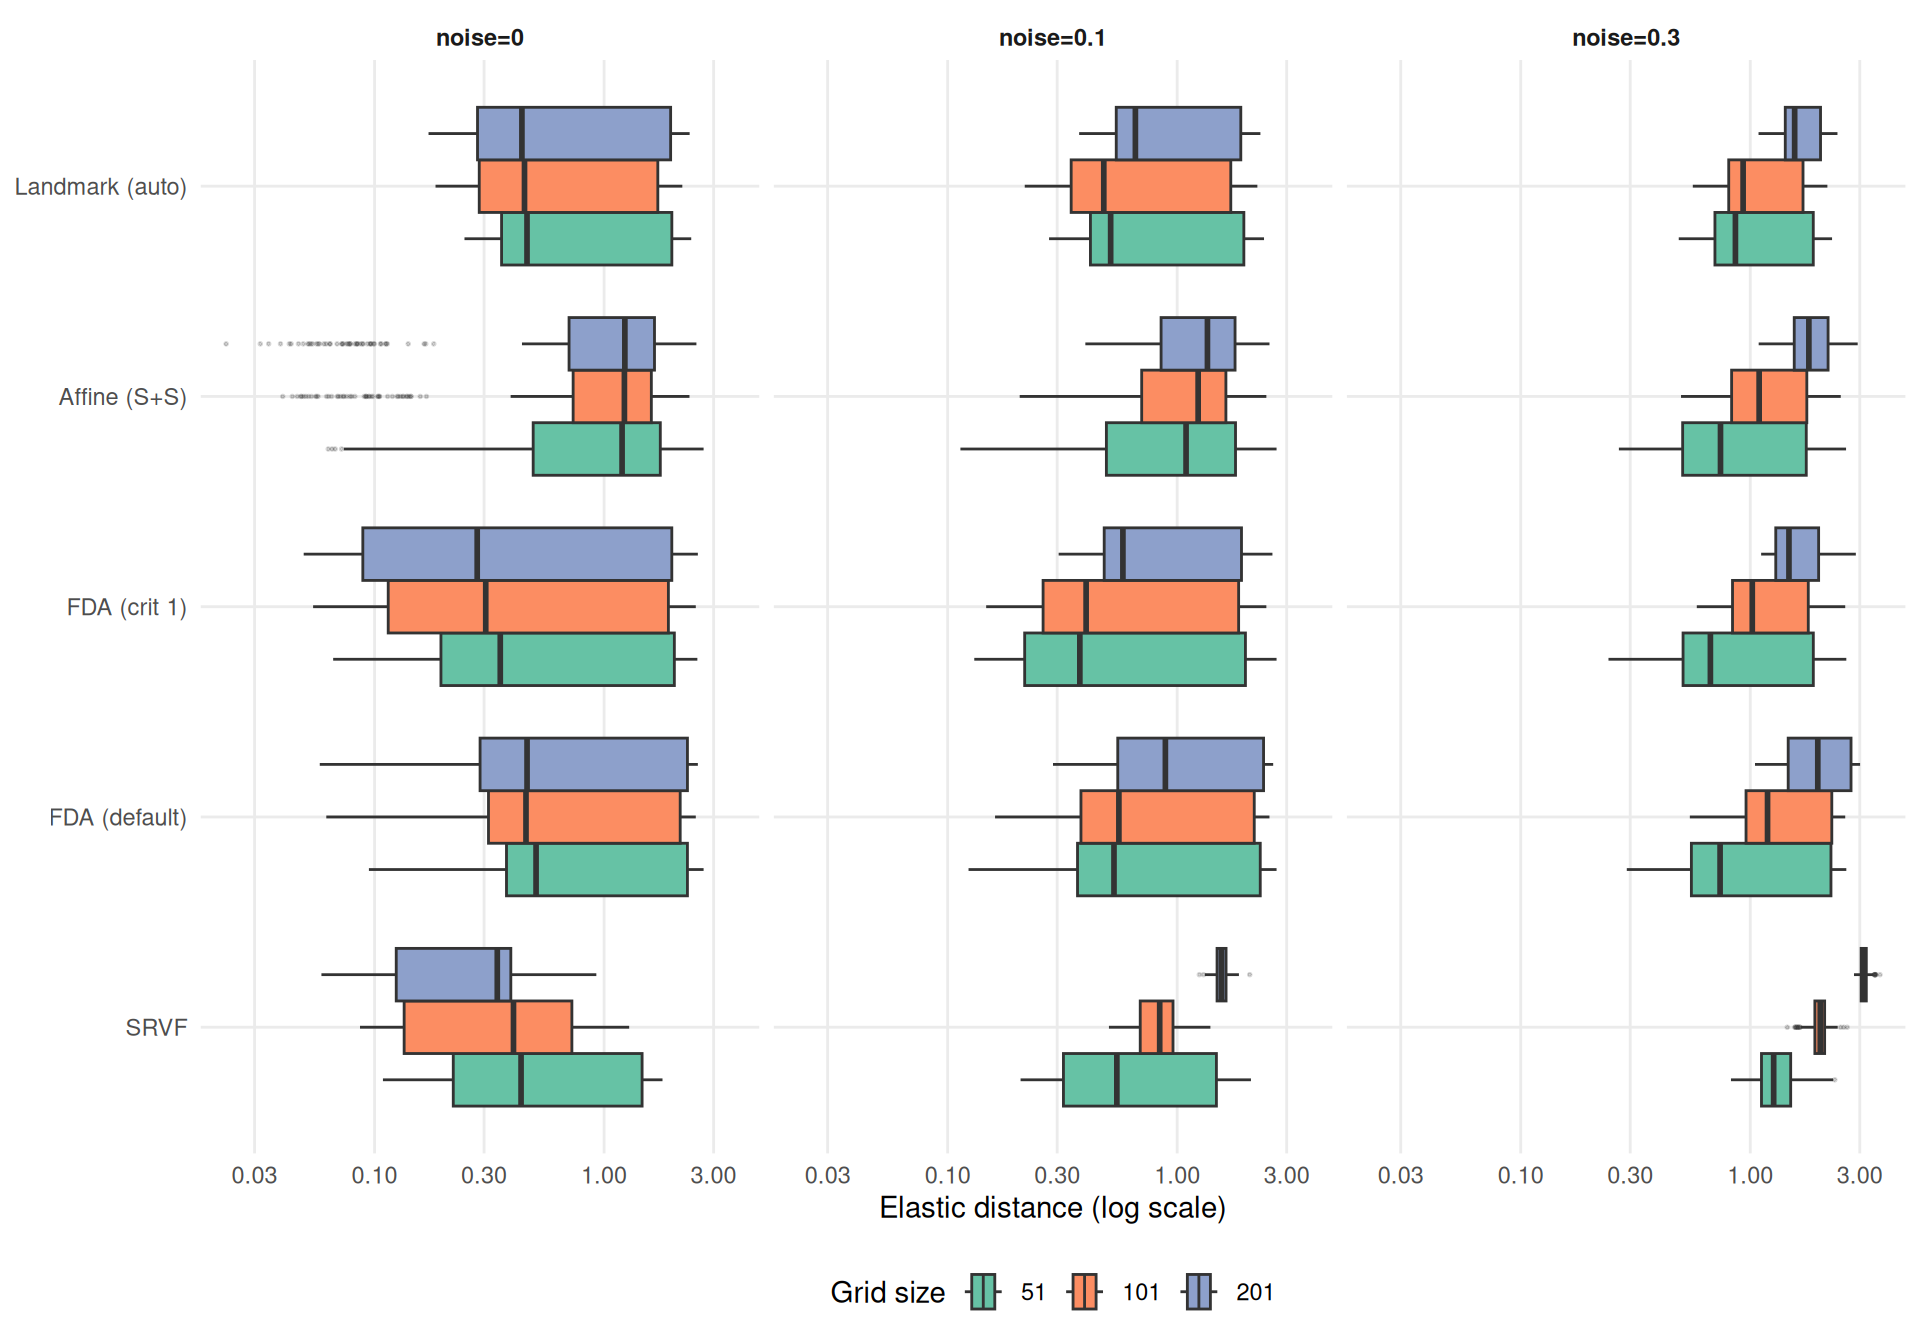
SRSF elastic distance is reparameterization-invariant. A numerical convergence test shows that finer grids yield slightly larger elastic distances for fixed function pairs (~4% from grid=51 to 1001 for smooth functions), but this effect is far too small to explain the patterns below. The large grid effects visible under noise are genuine: finer grids provide more noisy observation points to the template estimator, degrading the estimated template shape.
if ("template_elastic_dist" %in% names(dt) && any(!is.na(dt$template_elastic_dist))) {
  ggplot(
    dt[failure == FALSE & !is.na(template_elastic_dist)],
    aes(y = method, x = template_elastic_dist, fill = n_grid)
  ) +
    geom_boxplot(outlier.size = 0.3, outlier.alpha = 0.2, position = "dodge") +
    facet_wrap(~noise_sd,
      labeller = labeller(noise_sd = function(x) paste0("noise=", x))) +
    scale_y_discrete(labels = mlabs) +
    scale_x_log10() +
    scale_fill_brewer(palette = "Set2", name = "Grid size") +
    labs(y = NULL, x = "Elastic distance (log scale)") +
    theme_benchmark()
} else {
  cat("*Elastic distance not available in results.*")
}
if ("template_elastic_dist" %in% names(dt) && any(!is.na(dt$template_elastic_dist))) {
  e_ratio_rep <- dcast(
    dt[failure == FALSE & !is.na(template_elastic_dist),
      .(dgp, method, noise_sd, rep, n_grid, template_elastic_dist)],
    dgp + method + noise_sd + rep ~ n_grid,
    value.var = "template_elastic_dist"
  )
  e_ratio_rep[, ratio_51 := `51` / `101`]
  e_ratio_rep[, ratio_201 := `201` / `101`]
  e_ratio_rep <- melt(
    e_ratio_rep,
    id.vars = c("dgp", "method", "noise_sd", "rep"),
    measure.vars = c("ratio_51", "ratio_201"),
    variable.name = "n_grid",
    value.name = "ratio"
  )
  e_ratio_rep[, n_grid := sub("^ratio_", "", n_grid)]
  e_ratio_dt <- e_ratio_rep[, .(
    ratio = median(ratio, na.rm = TRUE),
    q25 = quantile(ratio, 0.25, na.rm = TRUE),
    q75 = quantile(ratio, 0.75, na.rm = TRUE)
  ), by = .(dgp, method, n_grid, noise_sd)]

  print(
    ggplot(e_ratio_dt, aes(x = ratio, y = method, color = method)) +
      geom_vline(xintercept = 1, linetype = "dashed", color = "grey40") +
      geom_point(size = 2, alpha = 0.7) +
      geom_errorbarh(aes(xmin = q25, xmax = q75), height = 0.15, alpha = 0.3) +
      geom_text(aes(label = dgp), size = 3, vjust = -0.8, show.legend = FALSE) +
      stat_summary(fun = median, geom = "crossbar", width = 0.4,
        color = "black", linewidth = 0.4) +
      facet_grid(n_grid ~ noise_sd,
        labeller = labeller(
          noise_sd = function(x) paste0("noise=", x),
          n_grid = function(x) paste0("grid=", x)
        )
      ) +
      scale_color_manual(values = mcols, guide = "none") +
      scale_y_discrete(labels = mlabs) +
      scale_x_continuous(trans = "log2",
        breaks = c(0.25, 0.5, 1, 2, 4),
        labels = c("1/4", "1/2", "1", "2", "4")
      ) +
      labs(
        x = expression("Elastic distance ratio vs grid=101 (" * log[2] * " scale)"),
        y = NULL
      ) +
      theme_benchmark()
  )
}
if ("template_elastic_dist" %in% names(dt) && any(!is.na(dt$template_elastic_dist))) {
e_ratio_dt2 <- dt[failure == FALSE & !is.na(template_elastic_dist),
.(elastic_dist = median(template_elastic_dist, na.rm = TRUE)),
by = .(dgp, method, n_grid, noise_sd)
]
e_base2 <- e_ratio_dt2[n_grid == "101",
.(dgp, method, noise_sd, base = elastic_dist)]
e_ratio_dt2 <- merge(e_ratio_dt2, e_base2, by = c("dgp", "method", "noise_sd"))
e_ratio_dt2[, ratio := elastic_dist / base]
e_ratio_dt2 <- e_ratio_dt2[n_grid != "101"]
e_summary <- e_ratio_dt2[,
.(median_ratio = median(ratio, na.rm = TRUE),
min_ratio = min(ratio, na.rm = TRUE),
max_ratio = max(ratio, na.rm = TRUE)),
by = .(method, n_grid)
]
cat("**Elastic distance ratios vs grid=101** (median [min, max] across DGPs and noise):\n\n")
for (g in sort(unique(as.character(e_summary$n_grid)))) {
cat(sprintf("*Grid = %s:*\n\n", g))
sub <- e_summary[n_grid == g][order(median_ratio)]
for (i in seq_len(nrow(sub))) {
cat(sprintf("- **%s**: %.2f [%.2f, %.2f]\n",
mlabs[sub$method[i]], sub$median_ratio[i],
sub$min_ratio[i], sub$max_ratio[i]))
}
cat("\n")
}
# Check if elastic distance shows same SRVF pattern as warp MISE
srvf_e <- e_ratio_dt2[method == "srvf",
.(median_ratio = median(ratio, na.rm = TRUE)),
by = .(n_grid, noise_sd)
]
srvf_e201_n0 <- srvf_e[n_grid == "201" & noise_sd == "0", median_ratio]
srvf_e201_n3 <- srvf_e[n_grid == "201" & noise_sd == "0.3", median_ratio]
if (length(srvf_e201_n0) > 0 && length(srvf_e201_n3) > 0) {
cat(sprintf(
"SRVF elastic distance ratio at grid=201: %.2f (noise=0), %.2f (noise=0.3). ",
srvf_e201_n0, srvf_e201_n3
))
if (srvf_e201_n3 > srvf_e201_n0) {
cat("Finer grids degrade template shape recovery more under noise, ",
"consistent with the warp MISE pattern.\n")
} else {
cat("The pattern differs from warp MISE — elastic distance is less ",
"sensitive to the grid × noise interaction for template estimation.\n")
}
}
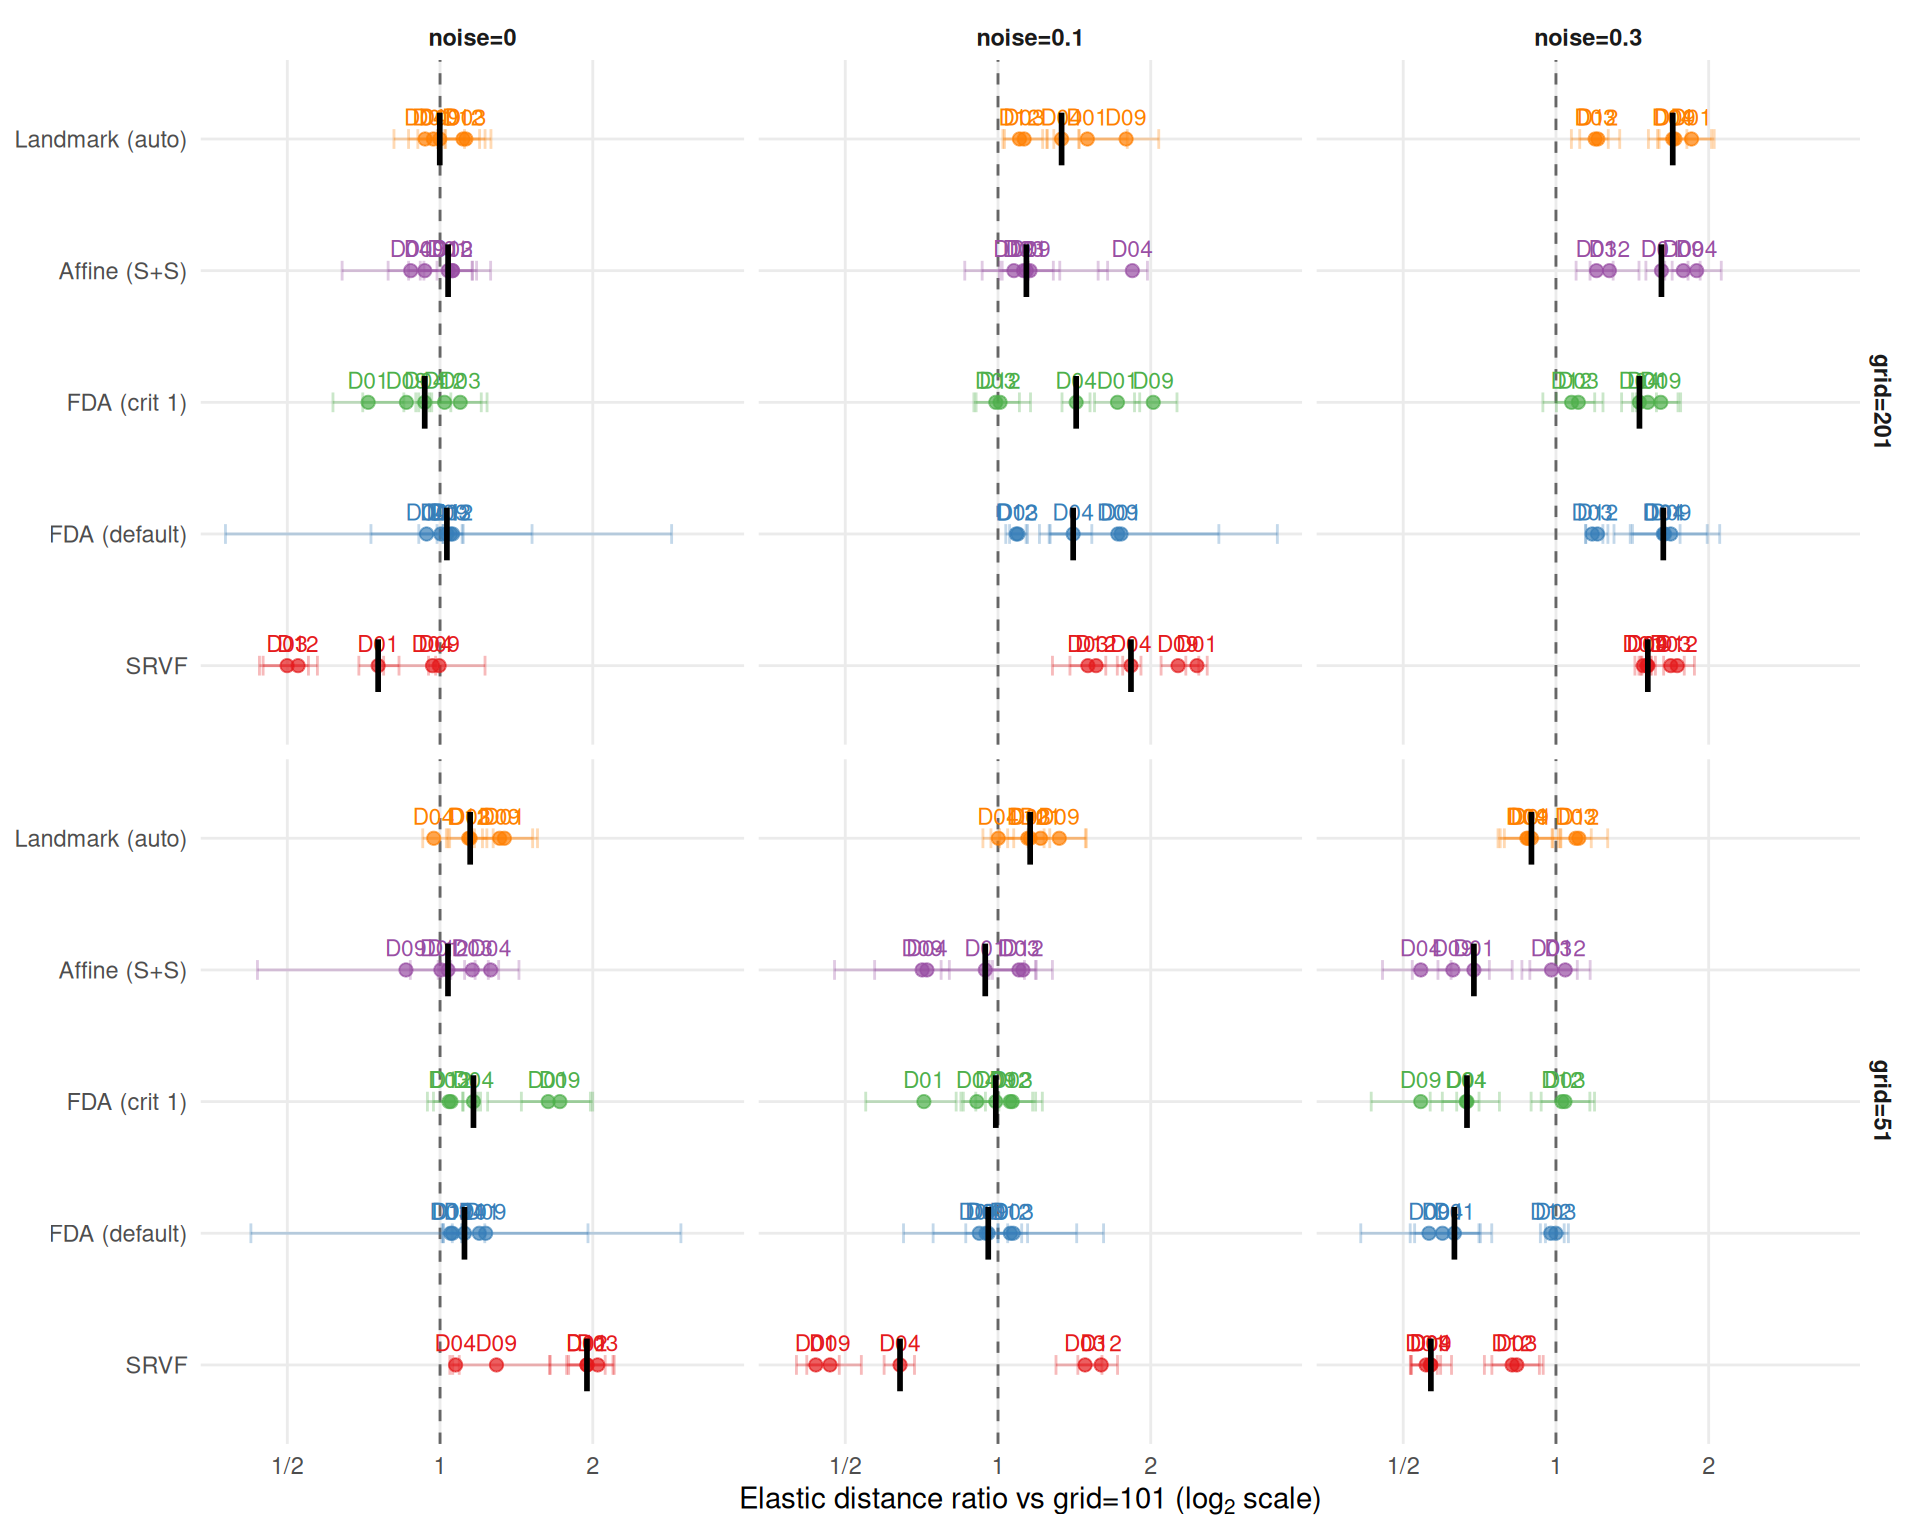
}Elastic distance ratios vs grid=101 (median [min, max] across DGPs and noise):
Grid = 201:
Grid = 51:
SRVF elastic distance ratio at grid=201: 0.75 (noise=0), 1.53 (noise=0.3). Finer grids degrade template shape recovery more under noise, consistent with the warp MISE pattern.
Alignment error measures the practical downstream impact: \(\text{mean}_i \int (\hat{x}_i^{\text{aligned}} - \tilde{x}_i)^2\,dt\). Do grid artifacts in warp estimation translate into worse alignment?
ggplot(
  dt[failure == FALSE],
  aes(y = method, x = alignment_error, fill = n_grid)
) +
  geom_boxplot(outlier.size = 0.3, outlier.alpha = 0.2, position = "dodge") +
  facet_wrap(~noise_sd, labeller = labeller(noise_sd = function(x) paste0("noise=", x))) +
  scale_y_discrete(labels = mlabs) +
  scale_x_log10() +
  scale_fill_brewer(palette = "Set2", name = "Grid size") +
  labs(y = NULL, x = "Alignment error (log scale)") +
  theme_benchmark()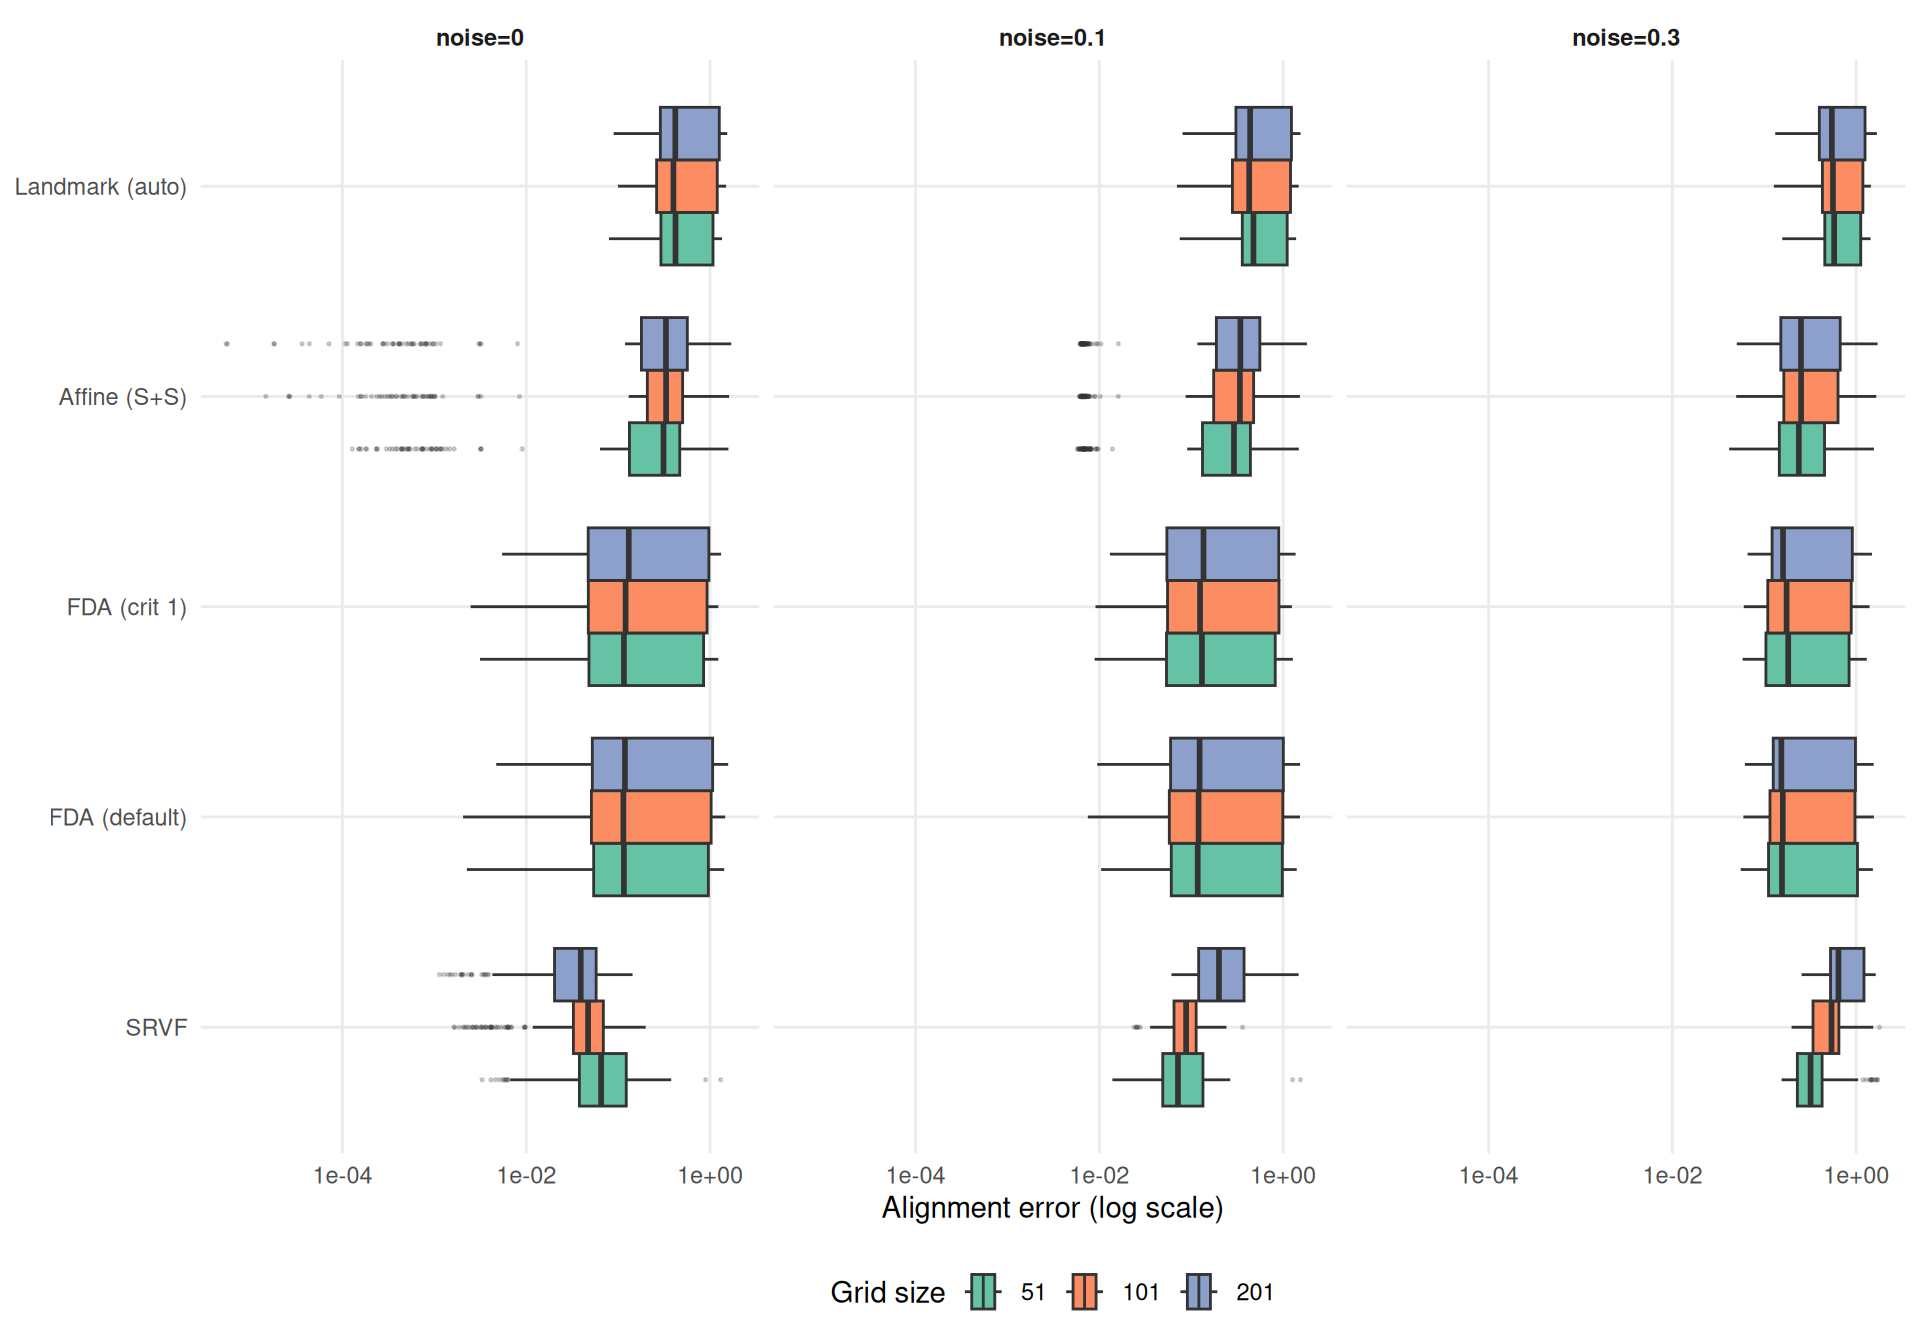
ae_ratio_rep <- dcast(
  dt[failure == FALSE, .(dgp, method, noise_sd, rep, n_grid, alignment_error)],
  dgp + method + noise_sd + rep ~ n_grid,
  value.var = "alignment_error"
)
ae_ratio_rep[, ratio_51 := `51` / `101`]
ae_ratio_rep[, ratio_201 := `201` / `101`]
ae_ratio_rep <- melt(
  ae_ratio_rep,
  id.vars = c("dgp", "method", "noise_sd", "rep"),
  measure.vars = c("ratio_51", "ratio_201"),
  variable.name = "n_grid",
  value.name = "ratio"
)
ae_ratio_rep[, n_grid := sub("^ratio_", "", n_grid)]
ae_ratio_dt <- ae_ratio_rep[, .(
  ratio = median(ratio, na.rm = TRUE),
  q25 = quantile(ratio, 0.25, na.rm = TRUE),
  q75 = quantile(ratio, 0.75, na.rm = TRUE)
), by = .(dgp, method, n_grid, noise_sd)]

ggplot(ae_ratio_dt, aes(x = ratio, y = method, color = method)) +
  geom_vline(xintercept = 1, linetype = "dashed", color = "grey40") +
  geom_point(size = 2, alpha = 0.7) +
  geom_errorbarh(aes(xmin = q25, xmax = q75), height = 0.15, alpha = 0.3) +
  geom_text(aes(label = dgp), size = 3, vjust = -0.8, show.legend = FALSE) +
  stat_summary(fun = median, geom = "crossbar", width = 0.4,
    color = "black", linewidth = 0.4) +
  facet_grid(n_grid ~ noise_sd,
    labeller = labeller(
      noise_sd = function(x) paste0("noise=", x),
      n_grid = function(x) paste0("grid=", x)
    )
  ) +
  scale_color_manual(values = mcols, guide = "none") +
  scale_y_discrete(labels = mlabs) +
  scale_x_continuous(trans = "log2",
    breaks = c(0.25, 0.5, 1, 2, 4),
    labels = c("1/4", "1/2", "1", "2", "4")
  ) +
  labs(x = expression("Alignment error ratio vs grid=101 (" * log[2] * " scale)"),
    y = NULL) +
  theme_benchmark()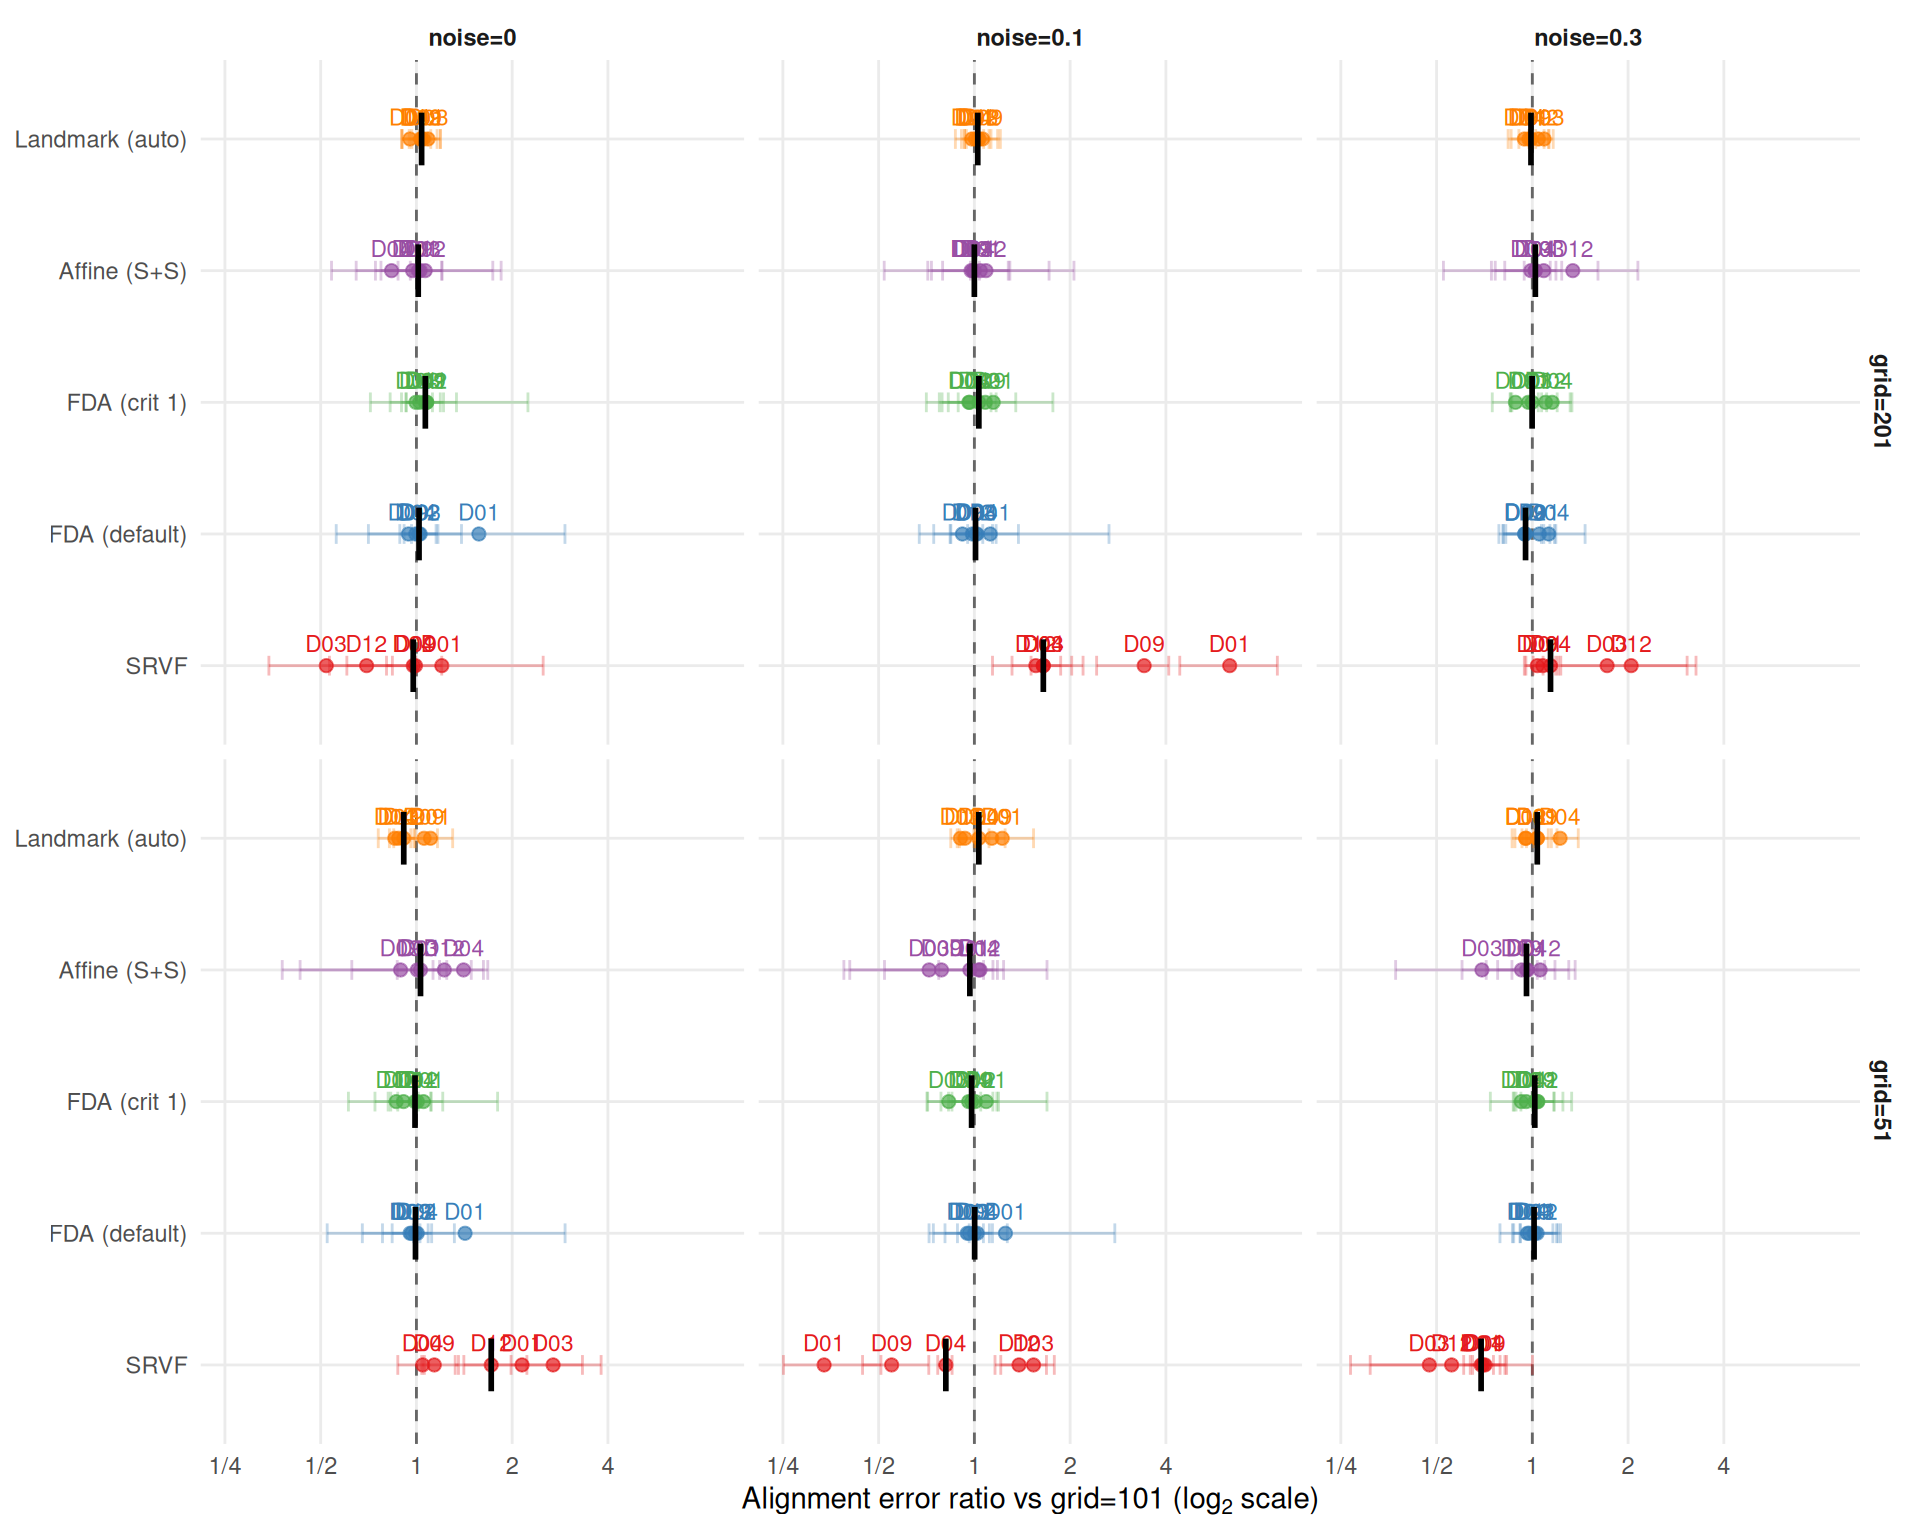
ae_ratio_summary <- ae_ratio_dt[,
  .(median_ratio = median(ratio, na.rm = TRUE),
    min_ratio = min(ratio, na.rm = TRUE),
    max_ratio = max(ratio, na.rm = TRUE)),
  by = .(method, n_grid)
]

cat("**Alignment error ratios vs grid=101** (median [min, max] across DGPs and noise):\n\n")
Alignment error ratios vs grid=101 (median [min, max] across DGPs and noise):
for (g in sort(unique(as.character(ae_ratio_summary$n_grid)))) {
  cat(sprintf("*Grid = %s:*\n\n", g))
  sub <- ae_ratio_summary[n_grid == g][order(median_ratio)]
  for (i in seq_len(nrow(sub))) {
    cat(sprintf("- **%s**: %.2f [%.2f, %.2f]\n",
      mlabs[sub$method[i]], sub$median_ratio[i],
      sub$min_ratio[i], sub$max_ratio[i]))
  }
  cat("\n")
}
Grid = 201:
Grid = 51:
# Compare with warp MISE ratios
warp_ratio_summary <- ratio_dt[,
  .(warp_median = median(ratio, na.rm = TRUE)),
  by = .(method, n_grid)
]
ae_ratio_summary2 <- ae_ratio_dt[,
  .(ae_median = median(ratio, na.rm = TRUE)),
  by = .(method, n_grid)
]
both <- merge(warp_ratio_summary, ae_ratio_summary2, by = c("method", "n_grid"))
r_grid <- cor(both$warp_median, both$ae_median, use = "complete.obs")
cat(sprintf(
  "Correlation between warp MISE and alignment error grid ratios: r = %.2f. ",
  r_grid))
Correlation between warp MISE and alignment error grid ratios: r = 0.89.
if (r_grid > 0.9) {
  cat("Grid effects on warp recovery translate almost directly into alignment quality.\n\n")
} else {
  cat("Grid effects on alignment error partially decouple from warp MISE — ",
    "alignment quality has some robustness to grid-induced warp artifacts.\n\n")
}
Grid effects on alignment error partially decouple from warp MISE — alignment quality has some robustness to grid-induced warp artifacts.
# SRVF-specific: does the noise-dependent reversal hold for alignment error too?
srvf_ae <- ae_ratio_dt[method == "srvf",
  .(median_ratio = median(ratio, na.rm = TRUE)),
  by = .(n_grid, noise_sd)]
srvf_ae51_n0 <- srvf_ae[n_grid == "51" & noise_sd == "0", median_ratio]
srvf_ae51_n3 <- srvf_ae[n_grid == "51" & noise_sd == "0.3", median_ratio]
srvf_ae201_n0 <- srvf_ae[n_grid == "201" & noise_sd == "0", median_ratio]
srvf_ae201_n3 <- srvf_ae[n_grid == "201" & noise_sd == "0.3", median_ratio]

if (length(srvf_ae51_n0) > 0 && length(srvf_ae201_n3) > 0) {
  cat(sprintf(
    "SRVF alignment error ratios: grid=51 is %.2f (noise=0), %.2f (noise=0.3); grid=201 is %.2f (noise=0), %.2f (noise=0.3). ",
    srvf_ae51_n0, srvf_ae51_n3, srvf_ae201_n0, srvf_ae201_n3))
  reversal <- (srvf_ae51_n0 > 1 && srvf_ae51_n3 < 1) ||
    (srvf_ae201_n0 < 1 && srvf_ae201_n3 > 1)
  if (reversal) {
    cat("The noise-dependent reversal observed for warp MISE is also present for alignment error.\n")
  } else {
    cat("The noise-dependent reversal pattern differs somewhat for alignment error.\n")
  }
}
SRVF alignment error ratios: grid=51 is 1.69 (noise=0), 0.68 (noise=0.3); grid=201 is 0.97 (noise=0), 1.16 (noise=0.3). The noise-dependent reversal observed for warp MISE is also present for alignment error.
The key question: does the combination of fine grid + high noise compound for SRVF?
int_dt <- dt[failure == FALSE,
  .(
    warp_mise = median(warp_mise, na.rm = TRUE),
    q25 = quantile(warp_mise, 0.25, na.rm = TRUE),
    q75 = quantile(warp_mise, 0.75, na.rm = TRUE)
  ),
  by = .(dgp, method, n_grid, noise_sd)
]

ggplot(int_dt, aes(x = n_grid, y = warp_mise, group = dgp, color = dgp)) +
  geom_line(alpha = 0.7) +
  geom_point(size = 2) +
  geom_errorbar(aes(ymin = q25, ymax = q75), width = 0.08, alpha = 0.25) +
  facet_grid(method ~ noise_sd,
    scales = "free_y",
    labeller = labeller(
      noise_sd = function(x) paste0("noise=", x),
      method = mlabs
    )
  ) +
  scale_y_log10() +
  labs(x = "Grid size", y = "Warp MISE (log scale)", color = "DGP") +
  theme_benchmark()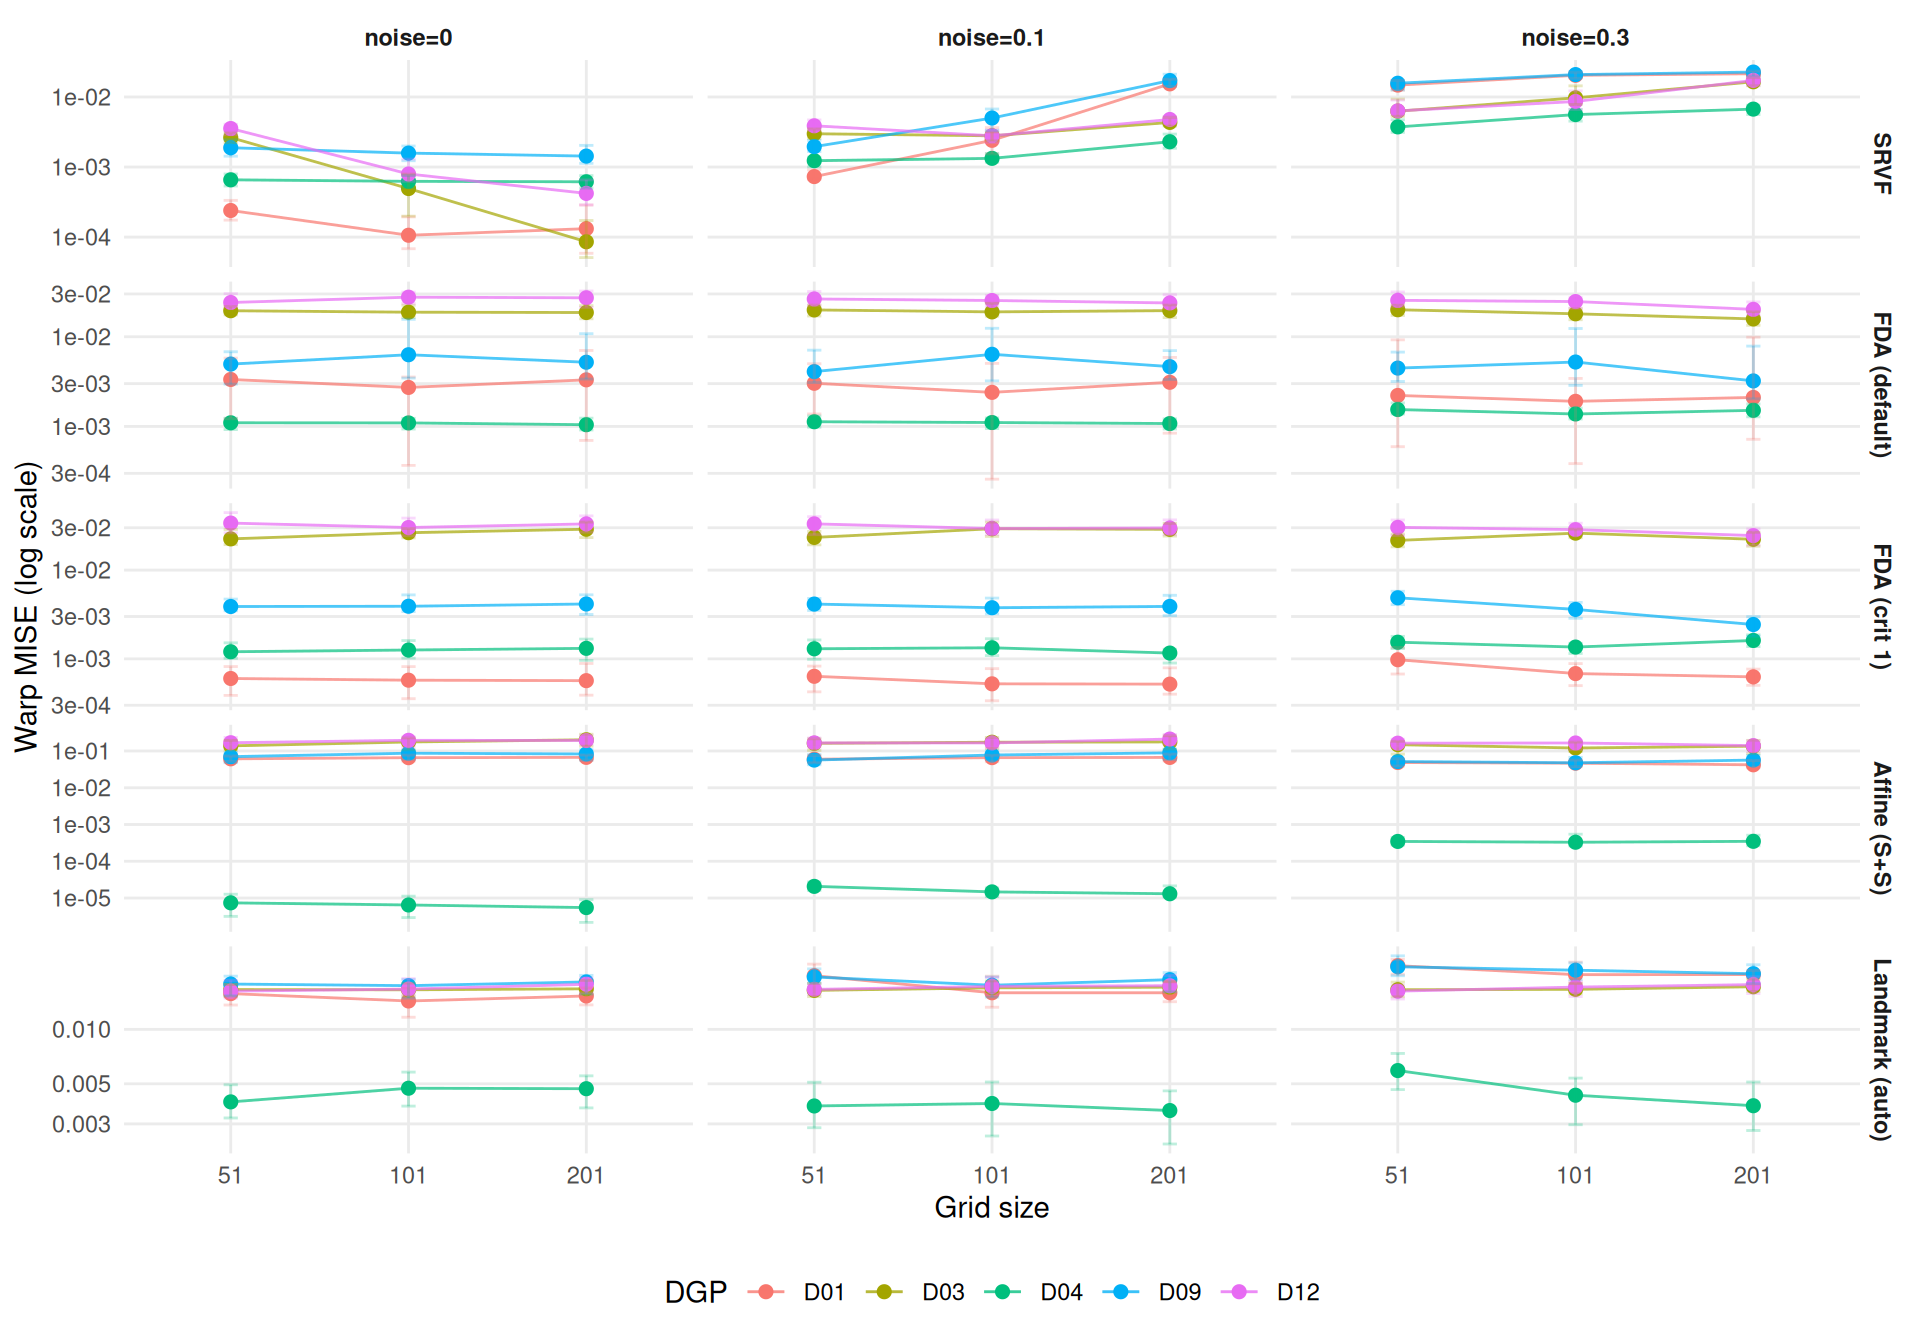
# Decompose compound effect into main effects + interaction
compound_dt <- dt[failure == FALSE,
  .(warp_mise = median(warp_mise, na.rm = TRUE)),
  by = .(dgp, method, n_grid, noise_sd)
]

# For SRVF: decompose the compound ratio
# Compound = (grid=201, noise=0.3) / (grid=101, noise=0)
# Noise main effect = (grid=101, noise=0.3) / (grid=101, noise=0)
# Grid main effect = (grid=201, noise=0) / (grid=101, noise=0)
# Interaction = compound / (noise_main * grid_main)

ref_clean <- compound_dt[n_grid == "101" & noise_sd == "0",
  .(dgp, method, ref = warp_mise)]
noise_main <- compound_dt[n_grid == "101" & noise_sd == "0.3",
  .(dgp, method, noisy = warp_mise)]
grid_main <- compound_dt[n_grid == "201" & noise_sd == "0",
  .(dgp, method, fine = warp_mise)]
stress <- compound_dt[n_grid == "201" & noise_sd == "0.3",
  .(dgp, method, stressed = warp_mise)]

decomp <- Reduce(function(a, b) merge(a, b, by = c("dgp", "method")),
  list(ref_clean, noise_main, grid_main, stress))
decomp[, `:=`(
  compound = stressed / ref,
  noise_effect = noisy / ref,
  grid_effect = fine / ref,
  interaction = (stressed / ref) / ((noisy / ref) * (fine / ref))
)]

cat("**Compound effect decomposition** ",
  "(grid=201/noise=0.3 vs grid=101/noise=0):\n\n")
Compound effect decomposition (grid=201/noise=0.3 vs grid=101/noise=0):
decomp_summary <- decomp[,
  .(
    compound = median(compound, na.rm = TRUE),
    noise_main = median(noise_effect, na.rm = TRUE),
    grid_main = median(grid_effect, na.rm = TRUE),
    interaction = median(interaction, na.rm = TRUE)
  ),
  by = method
][order(-compound)]

tbl2 <- c(
  "| Method | Compound | Noise main | Grid main | Interaction |",
  "|--------|----------|------------|-----------|-------------|"
)
for (i in seq_len(nrow(decomp_summary))) {
  tbl2 <- c(tbl2, sprintf("| %s | %.1f\u00d7 | %.1f\u00d7 | %.2f\u00d7 | %.2f\u00d7 |",
    mlabs[decomp_summary$method[i]],
    decomp_summary$compound[i],
    decomp_summary$noise_main[i],
    decomp_summary$grid_main[i],
    decomp_summary$interaction[i]))
}
cat(paste(tbl2, collapse = "\n"), "\n\n")| Method | Compound | Noise main | Grid main | Interaction |
|---|---|---|---|---|
| SRVF | 21.7× | 13.2× | 0.91× | 1.21× |
| Landmark (auto) | 1.1× | 1.0× | 1.05× | 0.94× |
| FDA (crit 1) | 0.8× | 1.0× | 1.06× | 0.78× |
| FDA (default) | 0.8× | 0.9× | 0.98× | 0.88× |
| Affine (S+S) | 0.7× | 0.7× | 0.99× | 0.98× |
srvf_decomp <- decomp_summary[method == "srvf"]
cat(sprintf(
  "For SRVF, the compound ratio of %.1f× decomposes into a noise main effect ",
  srvf_decomp$compound
))
For SRVF, the compound ratio of 21.7× decomposes into a noise main effect
cat(sprintf(
  "of %.1f×, a grid main effect of %.2f×, and a super-multiplicative interaction ",
  srvf_decomp$noise_main, srvf_decomp$grid_main
))
of 13.2×, a grid main effect of 0.91×, and a super-multiplicative interaction
cat(sprintf(
  "of %.2f×. ", srvf_decomp$interaction
))
of 1.21×.
if (srvf_decomp$interaction > 1.1) {
  cat("The interaction exceeds 1, confirming that grid and noise effects ",
    "are super-additive for SRVF — fine grids amplify the noise problem ",
    "beyond what either factor alone would predict.\n\n")
} else if (srvf_decomp$interaction < 0.9) {
  cat("The interaction is below 1, suggesting the compound effect is ",
    "sub-multiplicative — the large compound ratio is mostly driven by ",
    "the noise main effect.\n\n")
} else {
  cat("The interaction is near 1, suggesting the compound effect is ",
    "approximately multiplicative — grid and noise contribute independently ",
    "with no synergy.\n\n")
}
The interaction exceeds 1, confirming that grid and noise effects are super-additive for SRVF — fine grids amplify the noise problem beyond what either factor alone would predict.
# Note on extreme max values
max_compound <- decomp[, .(max_compound = max(compound)), by = method]
extreme <- max_compound[max_compound > 10]
if (nrow(extreme) > 0) {
  cat("*Note:* Extreme compound ratios (")
  cat(paste(sprintf("%s: %.0f×", mlabs[extreme$method], extreme$max_compound),
    collapse = ", "))
  cat(") are driven by DGPs where the baseline (grid=101, noise=0) warp MISE ",
    "is very small, making the ratio sensitive to small absolute differences.\n\n")
}
Note: Extreme compound ratios (SRVF: 202×, Affine (S+S): 54×) are driven by DGPs where the baseline (grid=101, noise=0) warp MISE is very small, making the ratio sensitive to small absolute differences.
profile_dt <- dt[failure == FALSE,
  .(
    median = median(warp_mise, na.rm = TRUE),
    q25 = quantile(warp_mise, 0.25, na.rm = TRUE),
    q75 = quantile(warp_mise, 0.75, na.rm = TRUE)
  ),
  by = .(dgp, method, n_grid, noise_sd)
]

ggplot(profile_dt, aes(x = n_grid, y = median, color = noise_sd, group = noise_sd)) +
  geom_line(linewidth = 0.7) +
  geom_point(size = 2) +
  geom_errorbar(aes(ymin = q25, ymax = q75), width = 0.1, alpha = 0.4) +
  facet_grid(dgp ~ method, scales = "free_y",
    labeller = labeller(method = mlabs, dgp = dlabs)) +
  scale_y_log10() +
  scale_color_brewer(palette = "Dark2", name = "Noise") +
  labs(x = "Grid size", y = "Warp MISE (log scale)") +
  theme_benchmark(base_size = 9)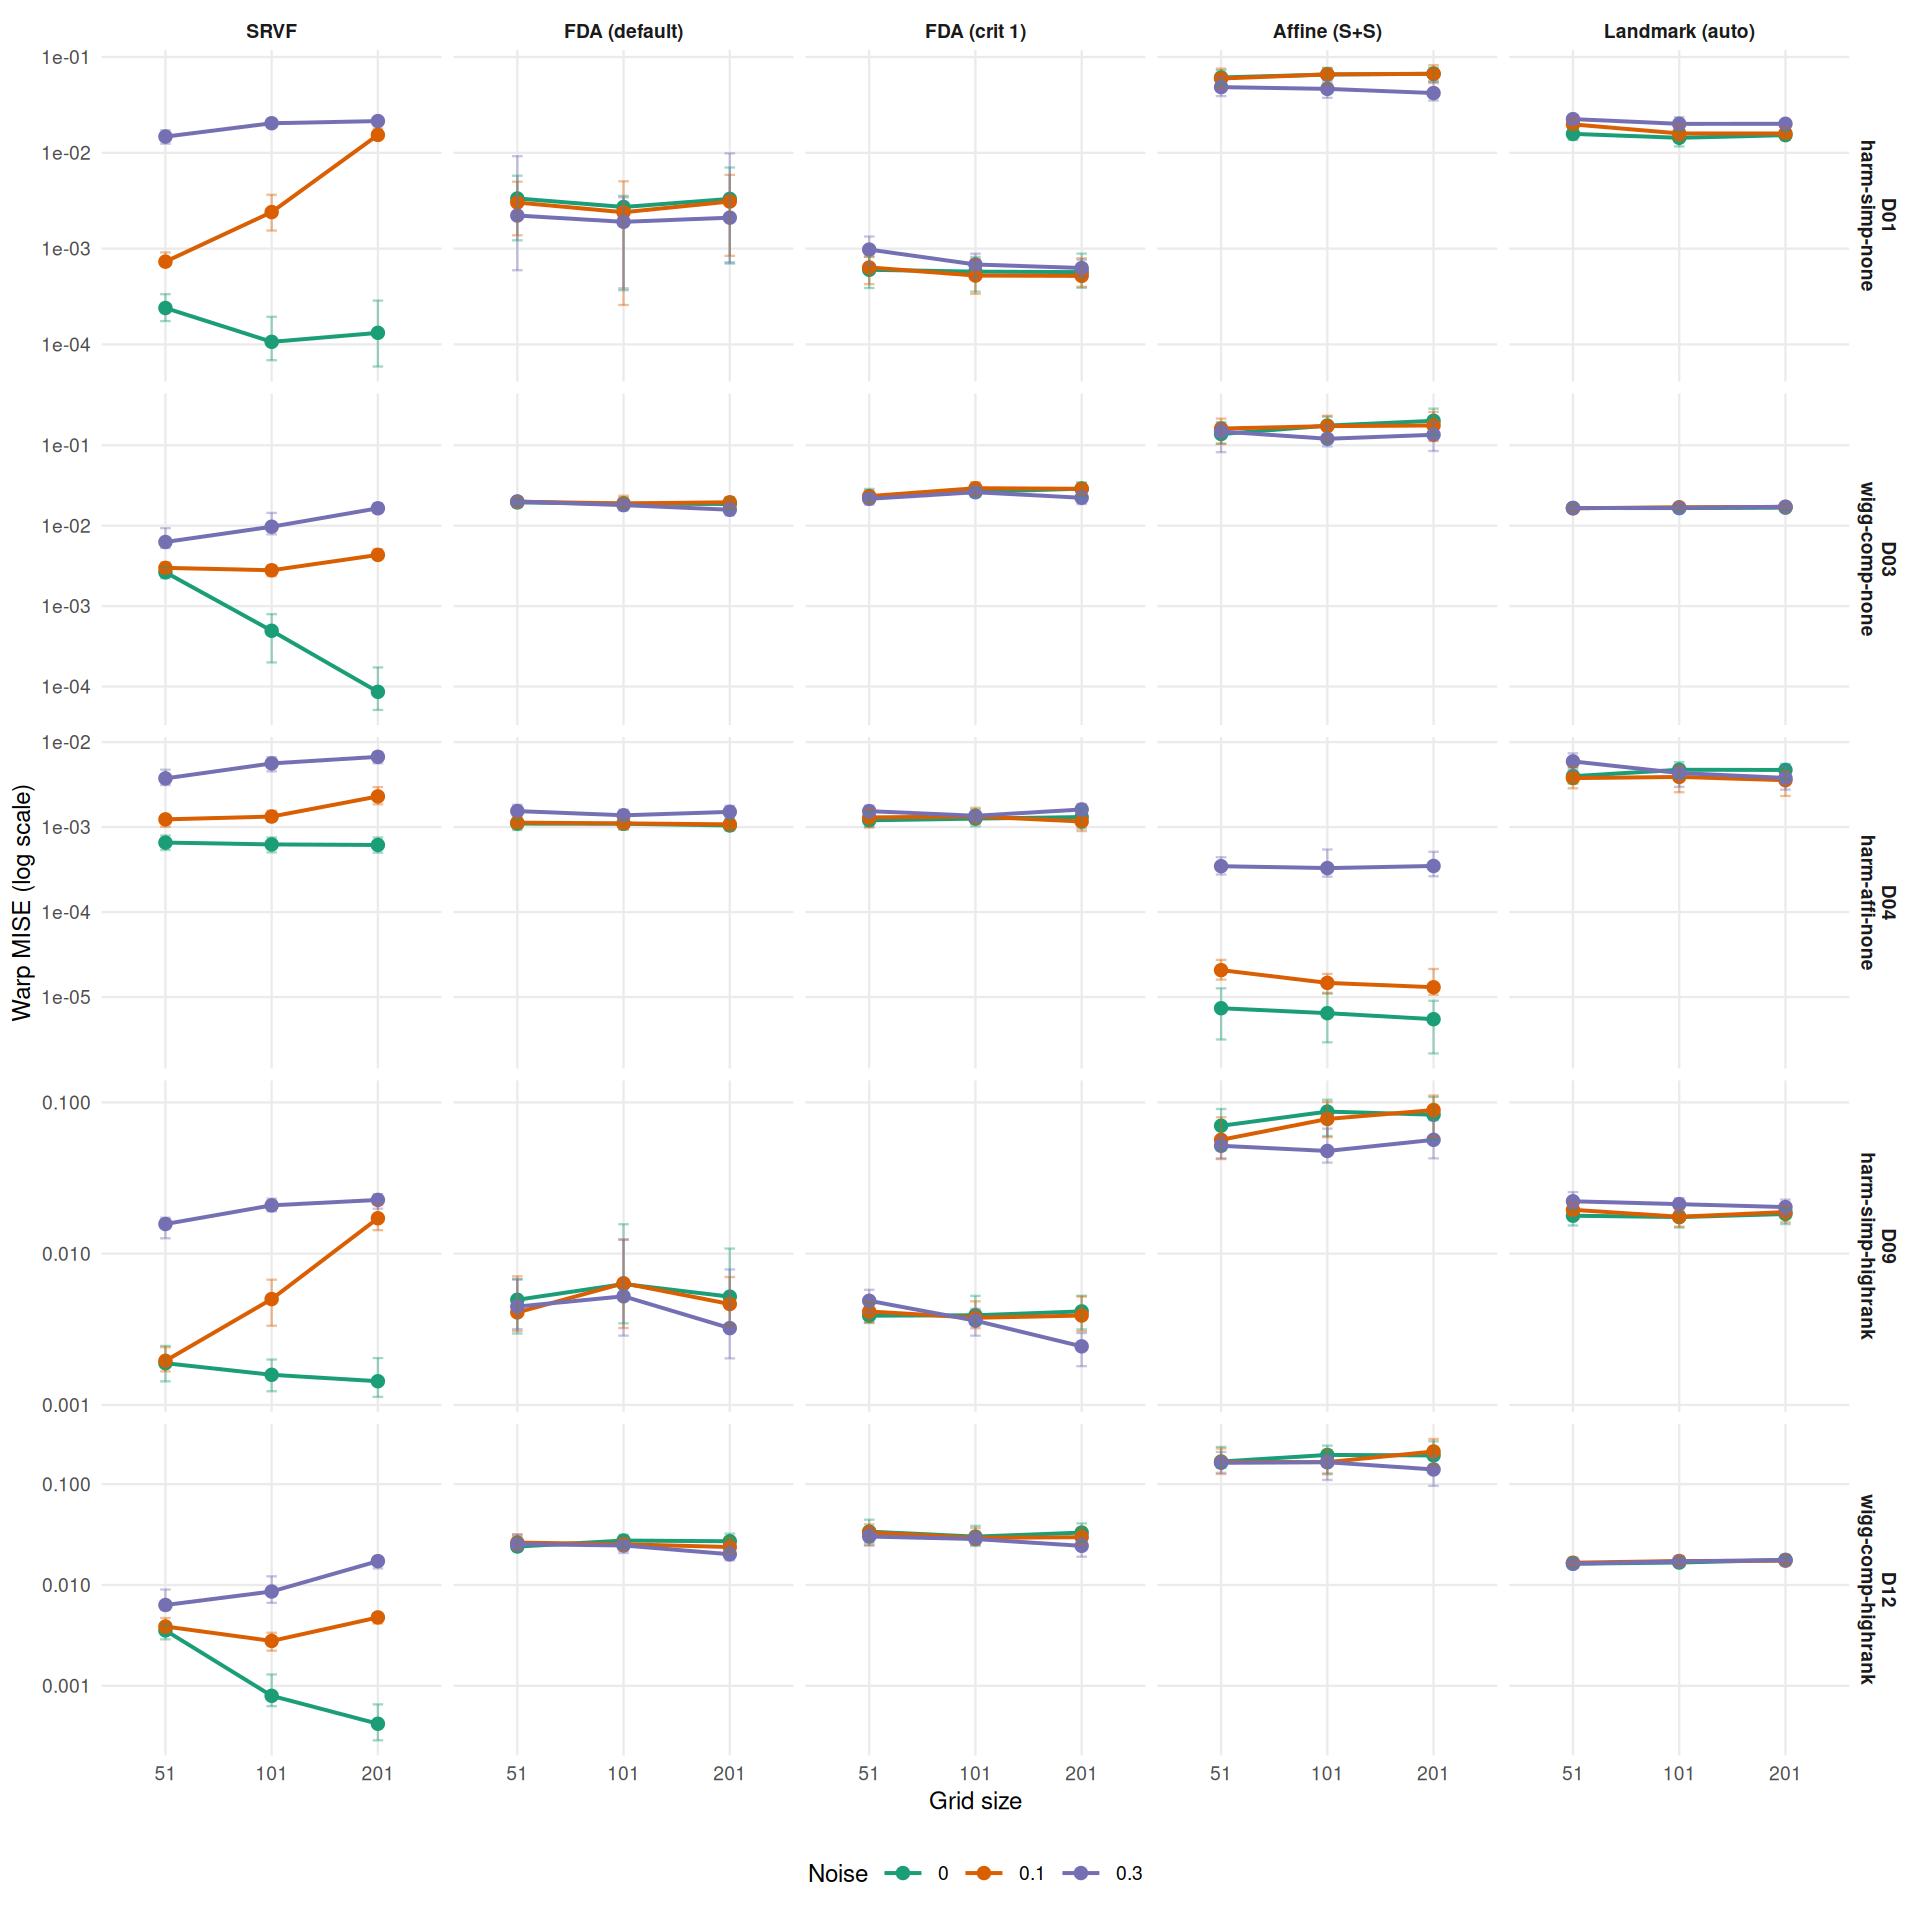
ggplot(
  dt[failure == FALSE],
  aes(x = n_grid, y = time_per_curve, fill = n_grid)
) +
  geom_boxplot(outlier.size = 0.3, outlier.alpha = 0.2) +
  facet_wrap(~method, nrow = 1, labeller = labeller(method = mlabs)) +
  scale_y_log10() +
  scale_fill_brewer(palette = "Set2", name = "Grid size") +
  labs(x = "Grid size", y = "Time per curve (sec, log scale)") +
  theme_benchmark()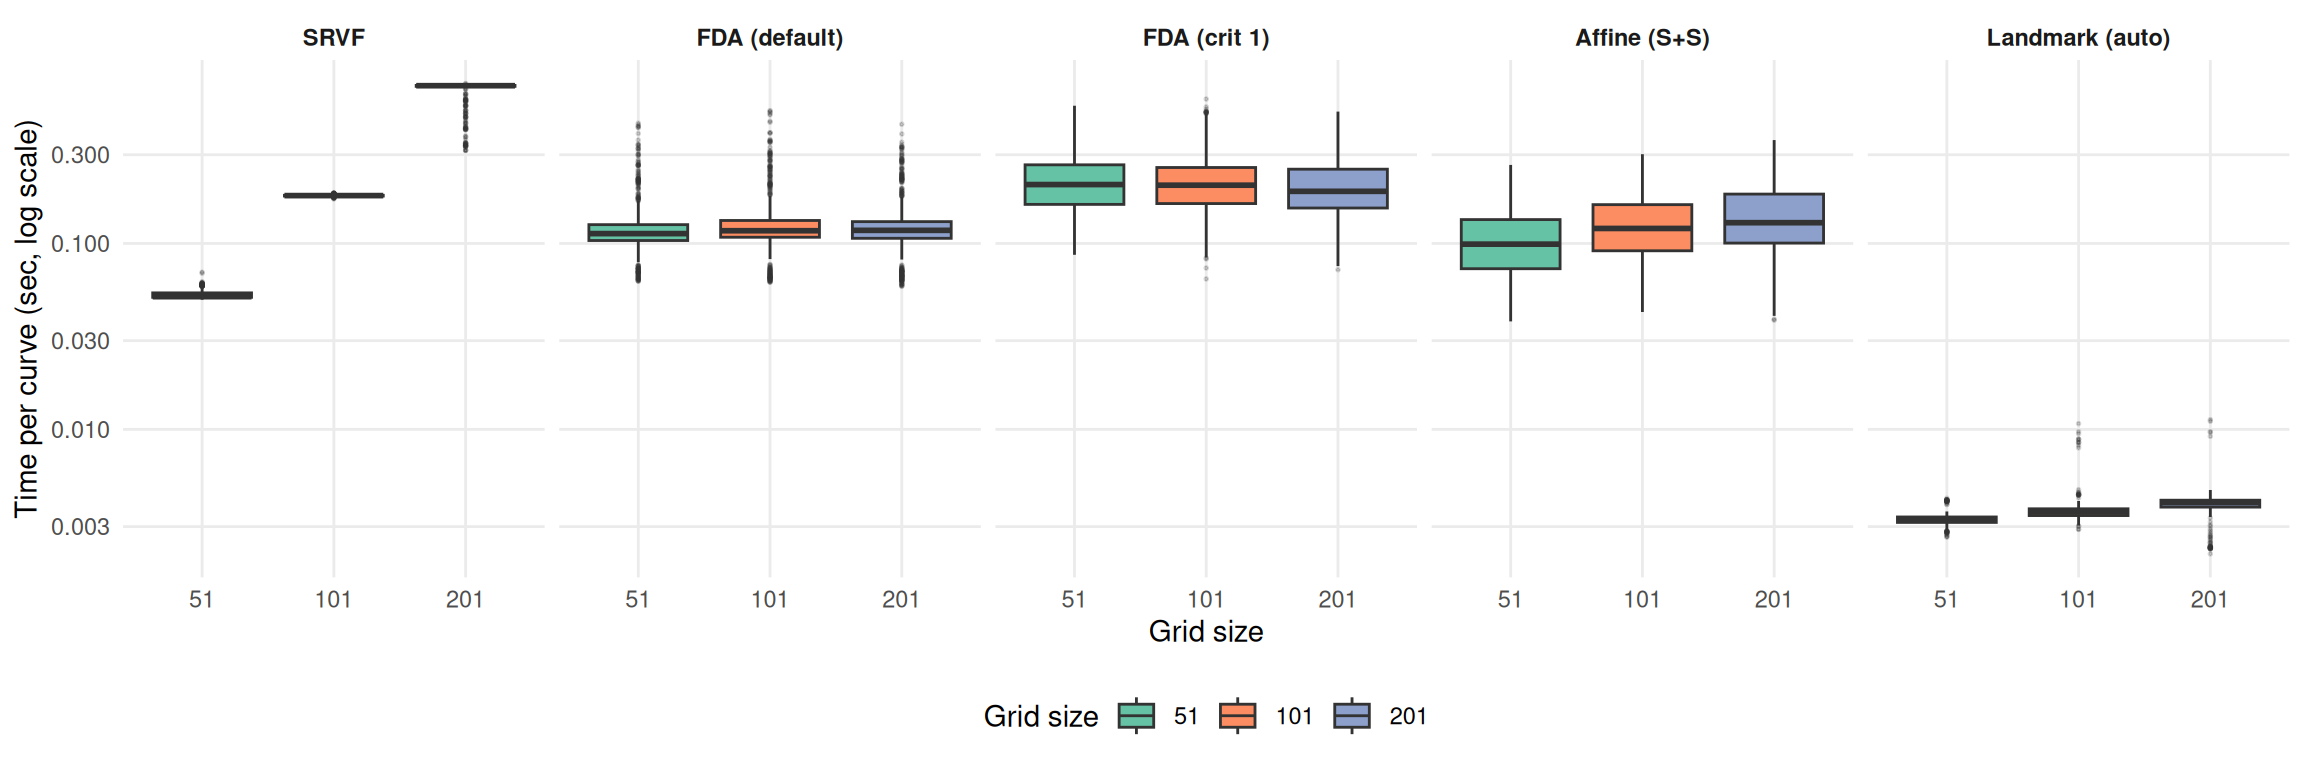
timing_dt <- dt[failure == FALSE,
  .(time_per_curve = median(time_per_curve, na.rm = TRUE)),
  by = .(method, n_grid)
]
timing_wide <- dcast(timing_dt, method ~ n_grid, value.var = "time_per_curve")

# Compute timing ratios
timing_wide[, ratio_201_101 := `201` / `101`]
timing_wide[, method := mlabs[method]]
cat("**Median time per curve (seconds) by method and grid size:**\n\n")
Median time per curve (seconds) by method and grid size:
print(knitr::kable(timing_wide, digits = 4))| method | 51 | 101 | 201 | ratio_201_101 |
|---|---|---|---|---|
| SRVF | 0.0517 | 0.1809 | 0.705 | 3.900 |
| CC (FPC1 cc) | 0.1130 | 0.1171 | 0.118 | 1.005 |
| CC (L2 dist) | 0.2074 | 0.2057 | 0.191 | 0.927 |
| Affine (S+S) | 0.0991 | 0.1204 | 0.129 | 1.074 |
| Landmark (auto) | 0.0033 | 0.0036 | 0.004 | 1.122 |
cat("\n")srvf_ratio <- timing_wide[method == "SRVF", ratio_201_101]
cat(sprintf(
"SRVF timing scales %.1f× from grid=101 to grid=201 (DP alignment is O(n²)). ",
srvf_ratio
))SRVF timing scales 3.9× from grid=101 to grid=201 (DP alignment is O(n²)).
cat("FDA methods show negligible timing change across grid sizes.\n")FDA methods show negligible timing change across grid sizes.
# Summary: for each method, median warp MISE ratio at grid=51 and grid=201 vs 101
ratio_summary_all <- ratio_dt[,
  .(median_ratio = median(ratio, na.rm = TRUE)),
  by = .(method, n_grid, noise_sd)
]
summary_wide <- dcast(ratio_summary_all,
  method + noise_sd ~ n_grid,
  value.var = "median_ratio"
)
summary_wide[, method := mlabs[method]]
cat("**Median warp MISE ratio vs grid=101** (by method and noise level):\n\n")
Median warp MISE ratio vs grid=101 (by method and noise level):
print(knitr::kable(summary_wide, digits = 2))| method | noise_sd | 51 | 201 |
|---|---|---|---|
| SRVF | 0 | 2.26 | 0.91 |
| SRVF | 0.1 | 0.93 | 1.73 |
| SRVF | 0.3 | 0.73 | 1.20 |
| FDA (default) | 0 | 1.00 | 0.98 |
| FDA (default) | 0.1 | 1.04 | 0.97 |
| FDA (default) | 0.3 | 1.11 | 0.88 |
| FDA (crit 1) | 0 | 0.99 | 1.06 |
| FDA (crit 1) | 0.1 | 1.10 | 0.99 |
| FDA (crit 1) | 0.3 | 1.13 | 0.86 |
| Affine (S+S) | 0 | 0.86 | 0.99 |
| Affine (S+S) | 0.1 | 0.93 | 1.02 |
| Affine (S+S) | 0.3 | 1.05 | 1.06 |
| Landmark (auto) | 0 | 1.00 | 1.05 |
| Landmark (auto) | 0.1 | 0.97 | 1.01 |
| Landmark (auto) | 0.3 | 1.04 | 1.00 |
cat("\n")cat("**Key findings:**\n\n")Key findings:
# 1. SRVF reversal
srvf_51_n0 <- ratio_dt[method == "srvf" & n_grid == "51" & noise_sd == "0",
  median(ratio, na.rm = TRUE)]
srvf_51_n3 <- ratio_dt[method == "srvf" & n_grid == "51" & noise_sd == "0.3",
  median(ratio, na.rm = TRUE)]
srvf_201_n0 <- ratio_dt[method == "srvf" & n_grid == "201" & noise_sd == "0",
  median(ratio, na.rm = TRUE)]
srvf_201_n3 <- ratio_dt[method == "srvf" & n_grid == "201" & noise_sd == "0.3",
  median(ratio, na.rm = TRUE)]

cat(sprintf(
  "1. **SRVF grid sensitivity reverses with noise.** At noise=0, grid=51 ",
  "degrades SRVF (%.2f×) while grid=201 helps (%.2f×). At noise=0.3, ",
  "grid=51 helps (%.2f×) while grid=201 degrades (%.2f×). Coarse grids ",
  "act as implicit regularization by smoothing numerical derivatives.\n\n",
  srvf_51_n0, srvf_201_n0, srvf_51_n3, srvf_201_n3
))# 2. FDA stability
fda_def_range <- ratio_dt[method == "fda_default",
.(lo = min(ratio, na.rm = TRUE), hi = max(ratio, na.rm = TRUE))]
cat(sprintf(
"2. **FDA methods are grid-insensitive.** fda_default ratios range from ",
"%.2f to %.2f across all grids, noise levels, and DGPs. fda_crit1 shows ",
"slight improvement at finer grids under noise.\n\n",
fda_def_range$lo, fda_def_range$hi
))# 3. Timing
cat("3. **SRVF timing scales steeply** (~4× per grid doubling due to O(n²) DP ",
"alignment). FDA timing is essentially constant across grids.\n\n")# 4. Practical
cat("4. **Grid=101 is a robust default** for `tf_register()`. It avoids SRVF ",
"degradation at finer grids while providing sufficient resolution for FDA ",
"methods. Users who need finer grids with SRVF should investigate whether ",
"penalization (Study B) can mitigate the derivative noise amplification — ",
"this hypothesis is not tested in Study C.\n\n")tf_register(). It avoids SRVF degradation at finer grids while providing sufficient resolution for FDA methods. Users who need finer grids with SRVF should investigate whether penalization (Study B) can mitigate the derivative noise amplification — this hypothesis is not tested in Study C.cat("5. **Grid resolution is a confound for SRVF benchmarking.** ",
"Method comparisons involving SRVF at grid=201 (or finer) ",
"will underestimate SRVF performance relative to FDA methods, especially ",
"under noise. Studies A and B use grid=101, which is neutral territory.\n")