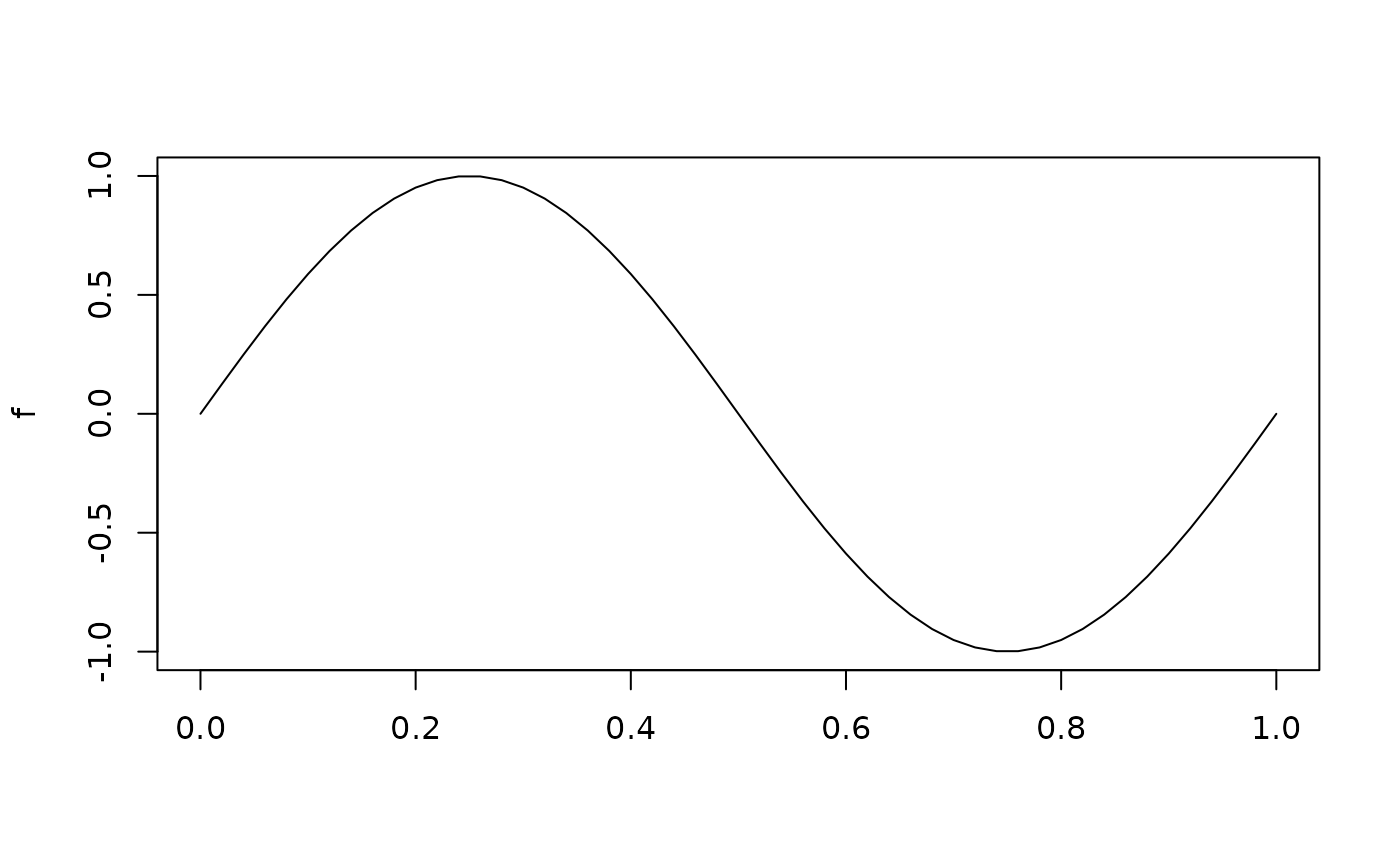
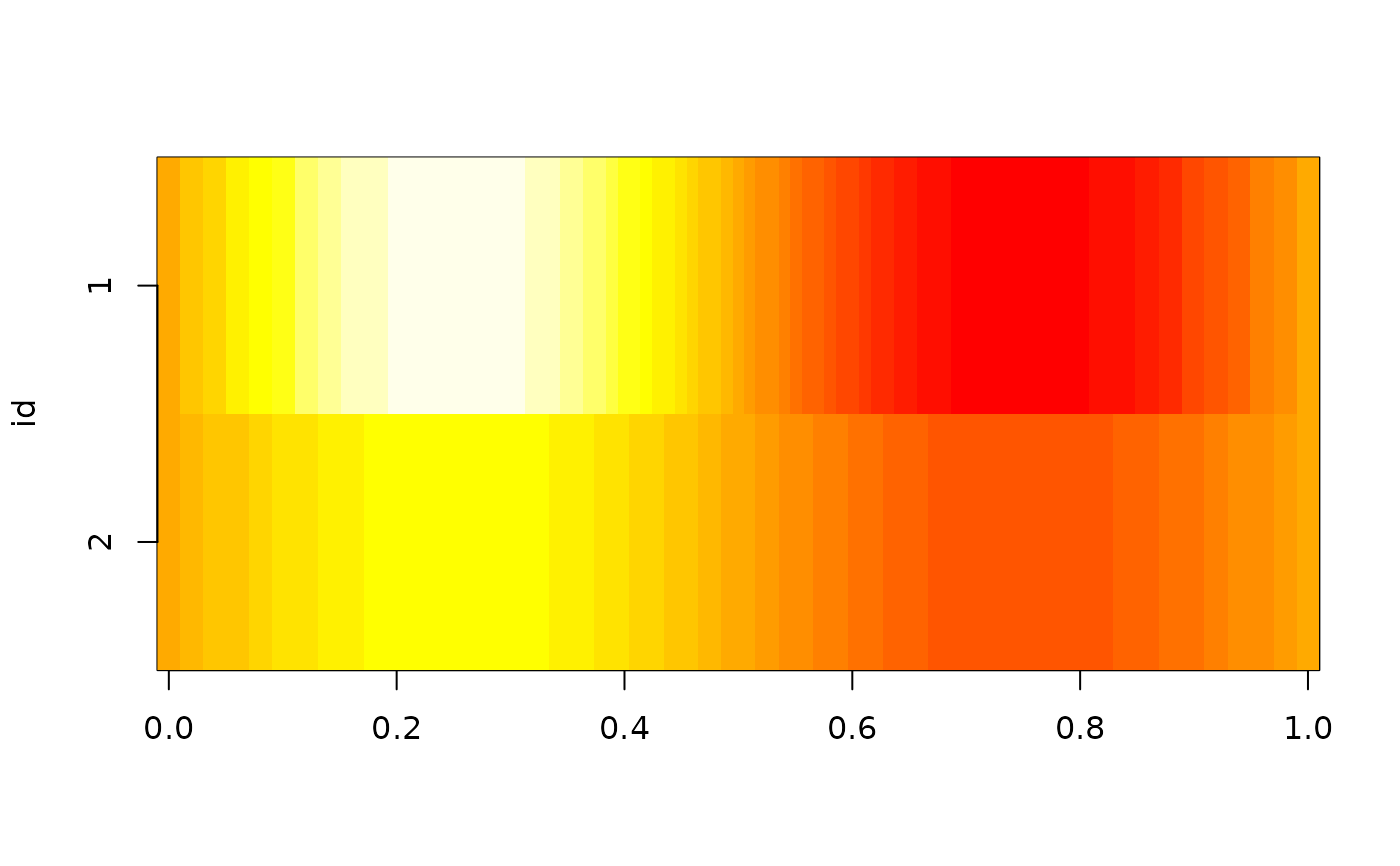
Some base functions for displaying functional data in
spaghetti- (i.e., line plots) and lasagna- (i.e., heat map) flavors.
Usage
# S3 method for class 'tf'
plot(
  x,
  y,
  n_grid = 50,
  points = is_irreg(x),
  type = c("spaghetti", "lasagna"),
  alpha = min(1, max(0.05, 2/length(x))),
  ...
)

# S3 method for class 'tf'
lines(x, arg, n_grid = 50, alpha = min(1, max(0.05, 2/length(x))), ...)

# S3 method for class 'tf'
points(
  x,
  arg,
  n_grid = NA,
  alpha = min(1, max(0.05, 2/length(x))),
  interpolate = FALSE,
  ...
)
Arguments
- x
a
tfobject.- y
(optional) numeric vector of evaluation points to use as
argfor plotting (passed as the function's input grid, not the y-axis values).- n_grid
minimal size of equidistant grid used for plotting, defaults to
50. See details.- points
should the original evaluation points be marked by points? Defaults to
TRUEfor irregulartfdandFALSEfor all others.- type
"spaghetti": line plots,"lasagna": heat maps.- alpha
alpha-value (see
grDevices::rgb()) for noodle transparency. Defaults to 2/(no. of observations). Lower is more transparent.- ...
additional arguments for
graphics::matplot()("spaghetti") orimage()("lasagna").- arg
evaluation grid (vector).
- interpolate
should functions be evaluated (i.e., inter-/extrapolated) for arg for which no original data is available? Only relevant for tfd, defaults to
FALSE.
Details
If no second argument y is given, evaluation points (arg) for the functions
are given by the union of the tf's arg and an equidistant grid
over its domain with n_grid points. If you want to only see the original
data for tfd-objects without inter-/extrapolation, use n_grid < 1 or
n_grid = NA.